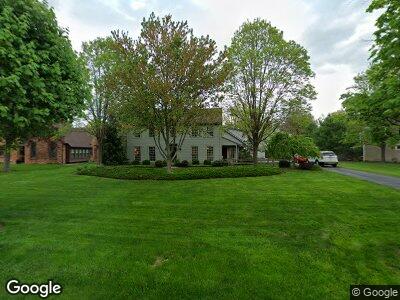
169 N Hayden Pkwy Hudson, OH 44236
Estimated Value: $609,000 - $921,000
6
Beds
3
Baths
4,348
Sq Ft
$169/Sq Ft
Est. Value
About This Home
This home is located at 169 N Hayden Pkwy, Hudson, OH 44236 and is currently estimated at $733,409, approximately $168 per square foot. 169 N Hayden Pkwy is a home located in Summit County with nearby schools including Ellsworth Hill Elementary School, East Woods Intermediate School, and Hudson Middle School.
Ownership History
Date
Name
Owned For
Owner Type
Purchase Details
Closed on
Feb 27, 2008
Sold by
Borzi Alice R
Bought by
Ivey Bret E and Ivey Leigha C
Current Estimated Value
Home Financials for this Owner
Home Financials are based on the most recent Mortgage that was taken out on this home.
Original Mortgage
$252,000
Interest Rate
5.75%
Mortgage Type
Purchase Money Mortgage
Purchase Details
Closed on
Aug 28, 2007
Sold by
Borzi Alice R
Bought by
Borzi Alice R and Borzi Mark G
Home Financials for this Owner
Home Financials are based on the most recent Mortgage that was taken out on this home.
Original Mortgage
$225,000
Interest Rate
6.76%
Mortgage Type
Unknown
Create a Home Valuation Report for This Property
The Home Valuation Report is an in-depth analysis detailing your home's value as well as a comparison with similar homes in the area
Home Values in the Area
Average Home Value in this Area
Purchase History
| Date | Buyer | Sale Price | Title Company |
|---|---|---|---|
| Ivey Bret E | $315,000 | Attorney |
Source: Public Records
Mortgage History
| Date | Status | Borrower | Loan Amount |
|---|---|---|---|
| Closed | Ivey Brett E | $484,000 | |
| Closed | Ivey Brett E | $40,000 | |
| Closed | Ivey Brett E | $453,100 | |
| Closed | Ivey Brett E | $64,400 | |
| Closed | Ivey Bret E | $104,672 | |
| Closed | Ivey Brett E | $262,000 | |
| Closed | Ivey Bret E | $25,010 | |
| Closed | Ivey Brett E | $15,000 | |
| Closed | Ivey Bret E | $252,000 | |
| Closed | Borzi Alice R | $225,000 |
Source: Public Records
Tax History Compared to Growth
Tax History
| Year | Tax Paid | Tax Assessment Tax Assessment Total Assessment is a certain percentage of the fair market value that is determined by local assessors to be the total taxable value of land and additions on the property. | Land | Improvement |
|---|---|---|---|---|
| 2025 | $12,025 | $237,077 | $39,029 | $198,048 |
| 2024 | $12,025 | $237,077 | $39,029 | $198,048 |
| 2023 | $12,025 | $237,077 | $39,029 | $198,048 |
| 2022 | $10,503 | $184,776 | $30,254 | $154,522 |
| 2021 | $10,521 | $184,776 | $30,254 | $154,522 |
| 2020 | $10,335 | $184,770 | $30,250 | $154,520 |
| 2019 | $9,445 | $156,250 | $23,950 | $132,300 |
| 2018 | $7,946 | $131,780 | $23,950 | $107,830 |
| 2017 | $6,771 | $131,780 | $23,950 | $107,830 |
| 2016 | $6,882 | $110,030 | $23,950 | $86,080 |
| 2015 | $6,771 | $110,030 | $23,950 | $86,080 |
| 2014 | $6,791 | $110,030 | $23,950 | $86,080 |
| 2013 | $5,556 | $87,920 | $23,950 | $63,970 |
Source: Public Records
Map
Nearby Homes
- 2195 Victoria Pkwy
- 6900 Bauley Dr
- 2483 Victoria Pkwy
- 190 Aurora St
- 34 Aurora St
- 195 Ravenna St
- 6911 Post Ln
- 17 Brandywine Dr
- 49 Owen Brown St
- 0 Ravenna St Unit 4477602
- 7671 Hudson Park Dr
- 136 Sunset Dr
- 6565 Hammontree Dr
- 108 Sunset Dr
- 1795 Old Tannery Cir
- 7385 McShu Ln
- 45 Hudson Common Dr
- 2863 Saint George Dr
- 241 Ravenna St
- 14 Stokes Ln
- 169 N Hayden Pkwy
- 177 N Hayden Pkwy
- 163 N Hayden Pkwy
- 2175 Victoria Pkwy
- 185 N Hayden Pkwy
- 2185 Victoria Pkwy
- 170 N Hayden Pkwy
- 191 N Hayden Pkwy
- 176 N Hayden Pkwy
- 2262 Weir Dr
- 2252 Weir Dr
- 164 N Hayden Pkwy
- 155 N Hayden Pkwy
- 184 N Hayden Pkwy
- 2236 Weir Dr
- 2272 Weir Dr
- 6800 Saint James Cir
- 156 N Hayden Pkwy
- 199 N Hayden Pkwy
- 2222 Weir Dr