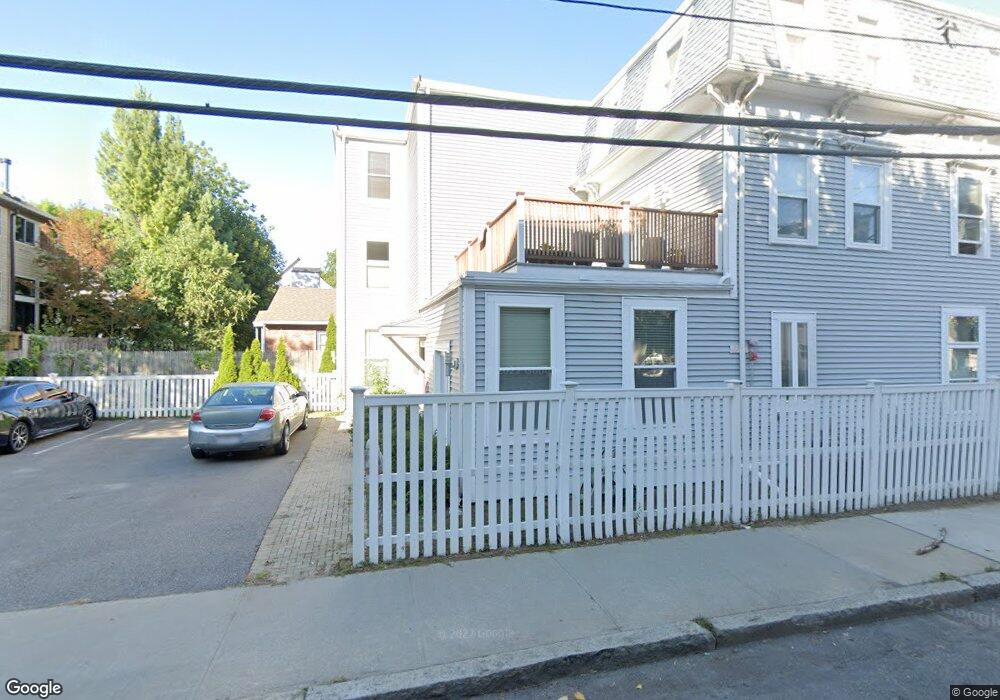
169 Pearl St Unit 1 Cambridge, MA 02139
Cambridgeport NeighborhoodEstimated Value: $763,998 - $865,000
2
Beds
1
Bath
720
Sq Ft
$1,150/Sq Ft
Est. Value
About This Home
This home is located at 169 Pearl St Unit 1, Cambridge, MA 02139 and is currently estimated at $827,750, approximately $1,149 per square foot. 169 Pearl St Unit 1 is a home located in Middlesex County with nearby schools including Prospect Hill Academy Charter School and Boston University Academy.
Ownership History
Date
Name
Owned For
Owner Type
Purchase Details
Closed on
Feb 10, 2021
Sold by
Balaram Robyn
Bought by
Luff William J and Cheng Fangyuan
Current Estimated Value
Home Financials for this Owner
Home Financials are based on the most recent Mortgage that was taken out on this home.
Original Mortgage
$540,000
Outstanding Balance
$482,971
Interest Rate
2.7%
Mortgage Type
Purchase Money Mortgage
Estimated Equity
$344,779
Purchase Details
Closed on
Dec 8, 2014
Sold by
Harmon John S and Harmon Gitrada A
Bought by
Tortorelli Robyn M
Home Financials for this Owner
Home Financials are based on the most recent Mortgage that was taken out on this home.
Original Mortgage
$375,900
Interest Rate
3.93%
Mortgage Type
New Conventional
Purchase Details
Closed on
Dec 2, 2005
Sold by
Salameh Youssef
Bought by
169 Pearl St Rlty Llc
Home Financials for this Owner
Home Financials are based on the most recent Mortgage that was taken out on this home.
Original Mortgage
$1,636,000
Interest Rate
6.14%
Mortgage Type
Purchase Money Mortgage
Create a Home Valuation Report for This Property
The Home Valuation Report is an in-depth analysis detailing your home's value as well as a comparison with similar homes in the area
Home Values in the Area
Average Home Value in this Area
Purchase History
| Date | Buyer | Sale Price | Title Company |
|---|---|---|---|
| Luff William J | $675,000 | None Available | |
| Tortorelli Robyn M | $501,200 | -- | |
| 169 Pearl St Rlty Llc | $1,200,000 | -- |
Source: Public Records
Mortgage History
| Date | Status | Borrower | Loan Amount |
|---|---|---|---|
| Open | Luff William J | $540,000 | |
| Previous Owner | Tortorelli Robyn M | $375,900 | |
| Previous Owner | 169 Pearl St Rlty Llc | $1,636,000 |
Source: Public Records
Tax History Compared to Growth
Tax History
| Year | Tax Paid | Tax Assessment Tax Assessment Total Assessment is a certain percentage of the fair market value that is determined by local assessors to be the total taxable value of land and additions on the property. | Land | Improvement |
|---|---|---|---|---|
| 2025 | $4,377 | $689,300 | $0 | $689,300 |
| 2024 | $3,906 | $659,800 | $0 | $659,800 |
| 2023 | $3,937 | $671,900 | $0 | $671,900 |
| 2022 | $3,891 | $657,300 | $0 | $657,300 |
| 2021 | $3,809 | $651,100 | $0 | $651,100 |
| 2020 | $3,697 | $642,900 | $0 | $642,900 |
| 2019 | $3,538 | $595,700 | $0 | $595,700 |
| 2018 | $1,322 | $545,900 | $0 | $545,900 |
| 2017 | $3,222 | $496,500 | $0 | $496,500 |
| 2016 | $2,961 | $423,600 | $0 | $423,600 |
| 2015 | $2,928 | $374,400 | $0 | $374,400 |
| 2014 | $2,879 | $343,500 | $0 | $343,500 |
Source: Public Records
Map
Nearby Homes
- 125 Brookline St Unit 4
- 161 Hamilton St
- 131 Erie St Unit 3
- 131 Erie St
- 174 Hamilton St
- 6-8 Watson St Unit 8
- 8 Watson St Unit 8
- 214 Allston St
- 127 Auburn St
- 129 Auburn St
- 1 Jay St
- 73 River St Unit 4B
- 300 Franklin St Unit 5
- 300 Franklin St Unit 1
- 300 Franklin St Unit 2
- 260 Sidney St Unit 3R
- 53 Jay St Unit 2
- 12 Inman St Unit 55
- 149A Bishop Allen Unit A
- 2 Hingham St
- 1 Corporal McTernan St Unit 1
- 169 Pearl St Unit 4
- 169 Pearl St Unit 3
- 169 Pearl St Unit 2
- 169 Pearl St
- 1 Mcternan St Unit 1
- 1 Mcternan St Unit 2
- 1 Corporal Mc Ternan St Unit 4
- 1 Corporal Mc Ternan St Unit 1
- 1 Corporal Mc Ternan St Unit 2
- 1 Corporal Mc Ternan St Unit 3
- 1 Mcternan St Unit 1
- 10 Mcternan St Unit 405
- 10 Mcternan St Unit 206
- 10 Mcternan St Unit 401
- 10 Mcternan St Unit 403
- 10 Mcternan St Unit 306
- 10 Mcternan St Unit 303
- 10 Mcternan St Unit 301
- 10 Mcternan St Unit 203