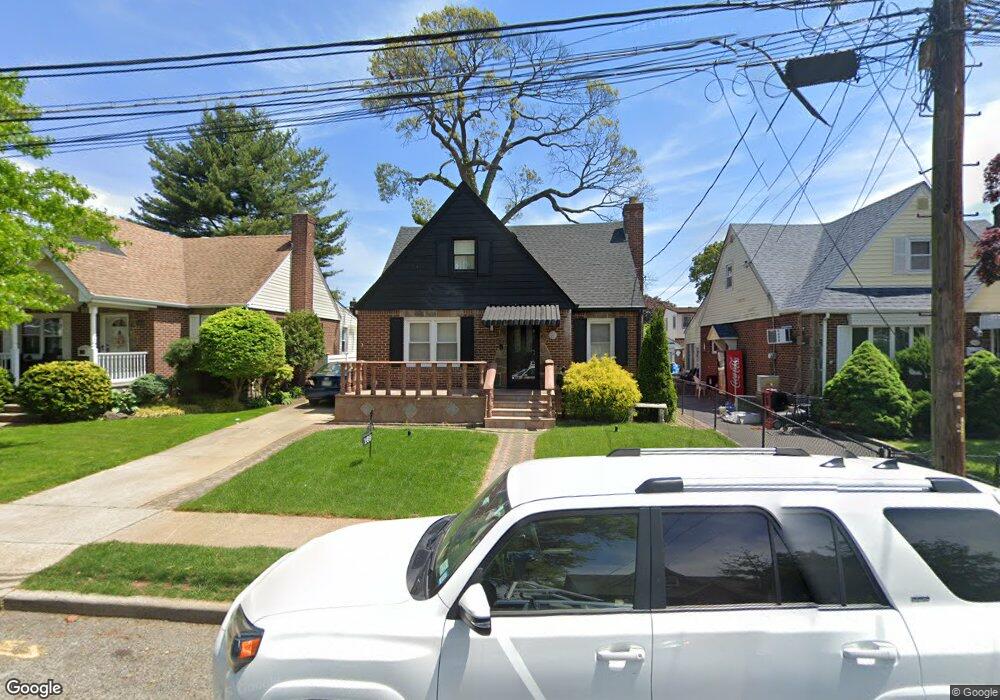
169 Rintin St Franklin Square, NY 11010
Estimated Value: $691,112 - $754,000
--
Bed
2
Baths
1,246
Sq Ft
$580/Sq Ft
Est. Value
About This Home
This home is located at 169 Rintin St, Franklin Square, NY 11010 and is currently estimated at $722,556, approximately $579 per square foot. 169 Rintin St is a home located in Nassau County with nearby schools including Hebrew Academy of Nassau County (HANC).
Ownership History
Date
Name
Owned For
Owner Type
Purchase Details
Closed on
Sep 29, 2023
Sold by
Phagoo Kirktimati and Hamchand Seonarine
Bought by
Levels To This Llc
Current Estimated Value
Purchase Details
Closed on
Jun 17, 2005
Sold by
Fedorczuk William
Bought by
Phagoo Kirtimati
Purchase Details
Closed on
Aug 1, 2001
Sold by
Vetter Kerin
Bought by
Fedorczuk William E
Create a Home Valuation Report for This Property
The Home Valuation Report is an in-depth analysis detailing your home's value as well as a comparison with similar homes in the area
Home Values in the Area
Average Home Value in this Area
Purchase History
| Date | Buyer | Sale Price | Title Company |
|---|---|---|---|
| Levels To This Llc | $225,000 | Clear Abstract Services Inc | |
| Levels To This Llc | $225,000 | Clear Abstract Services Inc | |
| Levels To This Llc | $225,000 | Clear Abstract Services Inc | |
| Phagoo Kirtimati | $465,000 | -- | |
| Phagoo Kirtimati | $465,000 | -- | |
| Fedorczuk William E | $295,000 | James Marsh | |
| Fedorczuk William E | $295,000 | James Marsh |
Source: Public Records
Tax History Compared to Growth
Tax History
| Year | Tax Paid | Tax Assessment Tax Assessment Total Assessment is a certain percentage of the fair market value that is determined by local assessors to be the total taxable value of land and additions on the property. | Land | Improvement |
|---|---|---|---|---|
| 2025 | $11,323 | $515 | $249 | $266 |
| 2024 | $4,911 | $515 | $249 | $266 |
| 2023 | $12,123 | $515 | $249 | $266 |
| 2022 | $12,123 | $515 | $249 | $266 |
| 2021 | $16,161 | $505 | $244 | $261 |
| 2020 | $13,202 | $845 | $510 | $335 |
| 2019 | $13,337 | $845 | $510 | $335 |
| 2018 | $12,687 | $845 | $0 | $0 |
| 2017 | $7,032 | $845 | $510 | $335 |
| 2016 | $11,331 | $845 | $510 | $335 |
| 2015 | $4,145 | $845 | $510 | $335 |
| 2014 | $4,145 | $845 | $510 | $335 |
| 2013 | $3,753 | $845 | $510 | $335 |
Source: Public Records
Map
Nearby Homes
- 144 Rintin St
- 190 Commonwealth St
- 249 Grange St
- 56 Fendale St
- 31 Claflin Blvd
- 676 Sobo Ave
- 279 Semton Blvd
- 149 Rule St
- 231 Dogwood Ave
- 198 Guildford Ct
- 594 Fenworth Blvd
- 715 Iris St
- 242 James St
- 775 Roosevelt St
- 249 Hoffman St
- 23 Monroe St
- 32 Madison Ave
- 301 Hoffman St
- 109 Caroline Ave
- 576 Western Park Dr