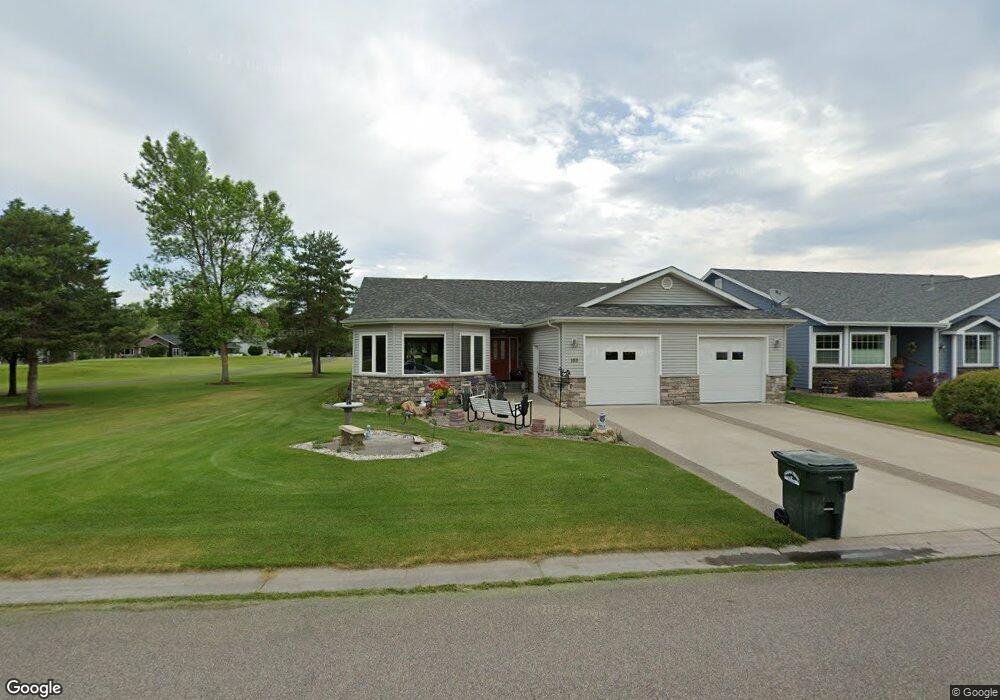
169 Ritzman Ln Kalispell, MT 59901
Estimated Value: $577,000 - $639,000
3
Beds
3
Baths
2,266
Sq Ft
$269/Sq Ft
Est. Value
About This Home
This home is located at 169 Ritzman Ln, Kalispell, MT 59901 and is currently estimated at $609,663, approximately $269 per square foot. 169 Ritzman Ln is a home located in Flathead County with nearby schools including Edgerton School, Kalispell Middle School, and Glacier High School.
Ownership History
Date
Name
Owned For
Owner Type
Purchase Details
Closed on
Aug 23, 2024
Sold by
Baker Robert C and Baker Kirstin
Bought by
Steele Archibald F
Current Estimated Value
Purchase Details
Closed on
Jul 23, 2024
Sold by
Morin Douglas and Moriarty Lorri L
Bought by
Tonkinson Irrevocable Trust
Purchase Details
Closed on
Oct 9, 2018
Sold by
Michael Eugene Morin
Bought by
Morin Douglas and Moriarty Lorri L
Purchase Details
Closed on
Sep 19, 2014
Sold by
Tonkinson Carolyn B and Morin Michael Eugene
Bought by
Morin Michael Eugene and Morin Douglas
Purchase Details
Closed on
Jul 8, 2014
Sold by
Tonkinson Carolyn B
Bought by
Tonkinson Carolyn B and Morin Michael Eugene
Purchase Details
Closed on
May 8, 2012
Sold by
Tonkinson Joint Living Trust Tom L & Car
Bought by
Tonkinson Carolyn B
Purchase Details
Closed on
Sep 17, 2008
Sold by
Tonkinson Tom and Tonkinson Carolyn
Bought by
Tonkinson Tom L and Tonkinson Carolyn B
Create a Home Valuation Report for This Property
The Home Valuation Report is an in-depth analysis detailing your home's value as well as a comparison with similar homes in the area
Purchase History
| Date | Buyer | Sale Price | Title Company |
|---|---|---|---|
| Steele Archibald F | -- | Fidelity National Title | |
| Tonkinson Irrevocable Trust | -- | None Listed On Document | |
| Morin Douglas | -- | None Available | |
| Morin Michael Eugene | -- | None Available | |
| Tonkinson Carolyn B | -- | None Available | |
| Tonkinson Carolyn B | -- | None Available | |
| Tonkinson Tom L | -- | None Available |
Source: Public Records
Tax History
| Year | Tax Paid | Tax Assessment Tax Assessment Total Assessment is a certain percentage of the fair market value that is determined by local assessors to be the total taxable value of land and additions on the property. | Land | Improvement |
|---|---|---|---|---|
| 2025 | $3,688 | $655,200 | $0 | $0 |
| 2024 | $4,093 | $525,600 | $0 | $0 |
| 2023 | $4,376 | $525,600 | $0 | $0 |
| 2022 | $4,233 | $381,800 | $0 | $0 |
| 2021 | $4,109 | $381,800 | $0 | $0 |
| 2020 | $3,906 | $330,600 | $0 | $0 |
| 2019 | $3,915 | $330,600 | $0 | $0 |
| 2018 | $4,335 | $353,800 | $0 | $0 |
| 2017 | $3,708 | $353,800 | $0 | $0 |
| 2016 | $3,628 | $320,100 | $0 | $0 |
| 2015 | $3,633 | $320,100 | $0 | $0 |
| 2014 | $3,331 | $175,483 | $0 | $0 |
Source: Public Records
Map
Nearby Homes
- 168 W Nicklaus Ave
- 116 Trevino Dr
- 203 W Nicklaus Ave
- 122 Granary Ridge Dr
- 63 Village Loop Unit 3
- 63 Village Loop Unit 1
- 114 W Nicklaus Ave
- 185 Palmer Dr
- 2196 Mission Trail
- 71 Glacier Cir
- 102 Buffalo Square Ct
- 284 W Nicklaus Ave
- 218 E Nicklaus Ave
- 269 W Nicklaus Ave
- 11 White Bark
- 217 E Nicklaus Ave
- 227 E Nicklaus Ave
- 44 Glacier Cir
- 112 River View Dr
- 38 Glacier Cir
- 167 Ritzman Ln
- 165 Ritzman Ln
- 12 Hogan Ln
- 166 Ritzman Ln
- 14 Hogan Ln
- 163 Ritzman Ln
- 164 Ritzman Ln
- 162 Ritzman Ln
- 17 Hogan Ln
- 160 Ritzman Ln
- 15 Hogan Ln
- 174 W Nicklaus Ave
- 176 W Nicklaus Ave
- 178 W Nicklaus Ave
- 180 W Nicklaus Ave
- 158 Ritzman Ln
- 170 W Nicklaus Ave
- 182 W Nicklaus Ave
- 184 W Nicklaus Ave
- 156 Ritzman Ln
Your Personal Tour Guide
Ask me questions while you tour the home.