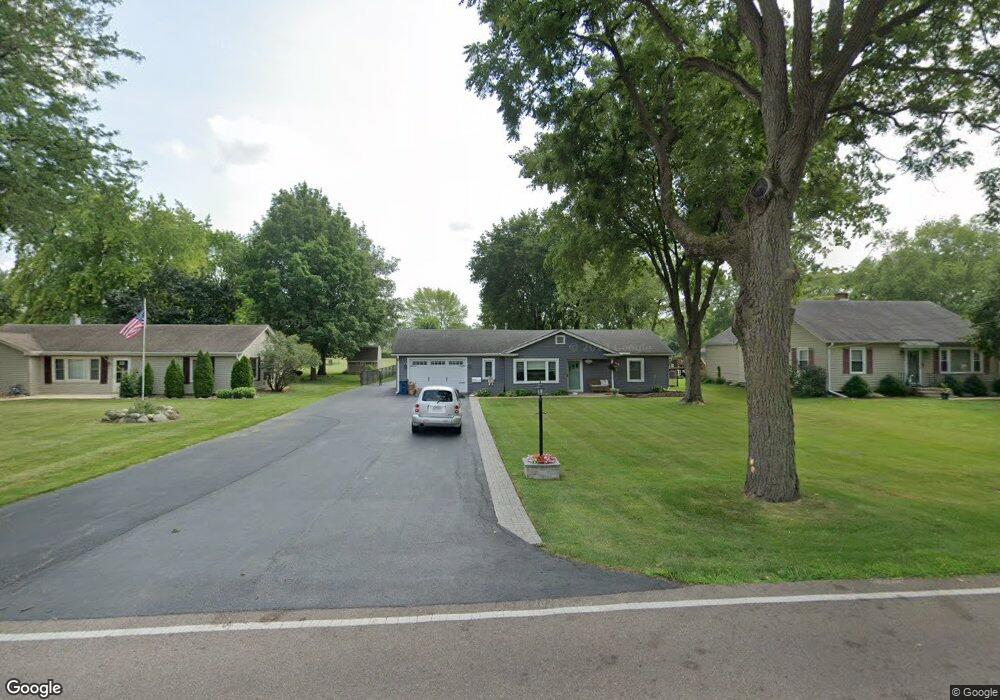
169 Sherman Ave Montgomery, IL 60538
Estimated Value: $334,943 - $388,000
--
Bed
1
Bath
1,752
Sq Ft
$201/Sq Ft
Est. Value
About This Home
This home is located at 169 Sherman Ave, Montgomery, IL 60538 and is currently estimated at $352,486, approximately $201 per square foot. 169 Sherman Ave is a home located in Kane County with nearby schools including Nicholson Elementary School, Washington Middle School, and West Aurora High School.
Ownership History
Date
Name
Owned For
Owner Type
Purchase Details
Closed on
Jun 3, 2016
Sold by
King Marvid D and King Shirley A
Bought by
Crouse Kevin J and Crouse Patrica D
Current Estimated Value
Home Financials for this Owner
Home Financials are based on the most recent Mortgage that was taken out on this home.
Original Mortgage
$204,212
Outstanding Balance
$161,463
Interest Rate
3.37%
Mortgage Type
FHA
Estimated Equity
$191,024
Purchase Details
Closed on
Dec 14, 2012
Sold by
Sowers Bradley
Bought by
King Marvin L and King Shirley
Create a Home Valuation Report for This Property
The Home Valuation Report is an in-depth analysis detailing your home's value as well as a comparison with similar homes in the area
Home Values in the Area
Average Home Value in this Area
Purchase History
| Date | Buyer | Sale Price | Title Company |
|---|---|---|---|
| Crouse Kevin J | $208,000 | Near North National Title | |
| King Marvin L | $14,833 | Stewart Title Company |
Source: Public Records
Mortgage History
| Date | Status | Borrower | Loan Amount |
|---|---|---|---|
| Open | Crouse Kevin J | $204,212 |
Source: Public Records
Tax History Compared to Growth
Tax History
| Year | Tax Paid | Tax Assessment Tax Assessment Total Assessment is a certain percentage of the fair market value that is determined by local assessors to be the total taxable value of land and additions on the property. | Land | Improvement |
|---|---|---|---|---|
| 2024 | $6,160 | $93,658 | $30,451 | $63,207 |
| 2023 | $5,888 | $83,683 | $27,208 | $56,475 |
| 2022 | $5,664 | $76,353 | $24,825 | $51,528 |
| 2021 | $5,398 | $71,085 | $23,112 | $47,973 |
| 2020 | $5,095 | $66,028 | $21,468 | $44,560 |
| 2019 | $4,936 | $61,177 | $19,891 | $41,286 |
| 2018 | $4,954 | $59,846 | $18,399 | $41,447 |
| 2017 | $6,030 | $69,505 | $16,953 | $52,552 |
| 2016 | $5,644 | $63,318 | $17,096 | $46,222 |
| 2015 | -- | $55,067 | $14,701 | $40,366 |
| 2014 | -- | $52,334 | $13,511 | $38,823 |
| 2013 | -- | $51,860 | $13,590 | $38,270 |
Source: Public Records
Map
Nearby Homes
- 1342 Oak Ridge Ln
- 170 Montgomery Rd
- 0 N River St
- 1422 Manning Ave
- 1375 Manning Ave
- 1440 Manning Ave
- 1405 Manning Ave
- 1336 Douglas Ave Unit 13
- 1707 Deer Run Dr
- Lot 1 Douglas Ave
- 1022 Sard Ave
- 962 Oliver Ave
- 106 Hamlet Cir
- 75 Briarcliff Rd
- 101 Red Fox Run
- 847 Oliver Ave
- 37 Fallcreek Cir
- 820 Oliver Ave
- 36 Fallcreek Cir Unit 35
- 815 Oliver Ave
- 173 Sherman Ave
- 163 Sherman Ave
- 175 Sherman Ave
- 170 Sherman Ave
- 174 Sherman Ave
- 181 Sherman Ave
- 160 Sherman Ave
- 151 Sherman Ave
- 178 Sherman Ave
- 154 Sherman Ave
- 185 Sherman Ave
- 180 Sherman Ave
- 150 Sherman Ave
- 145 Sherman Ave
- 187 Sherman Ave
- 182 Sherman Ave
- 141 Sherman Ave
- 146 Sherman Ave
- 191 Sherman Ave
- 184 Sherman Ave