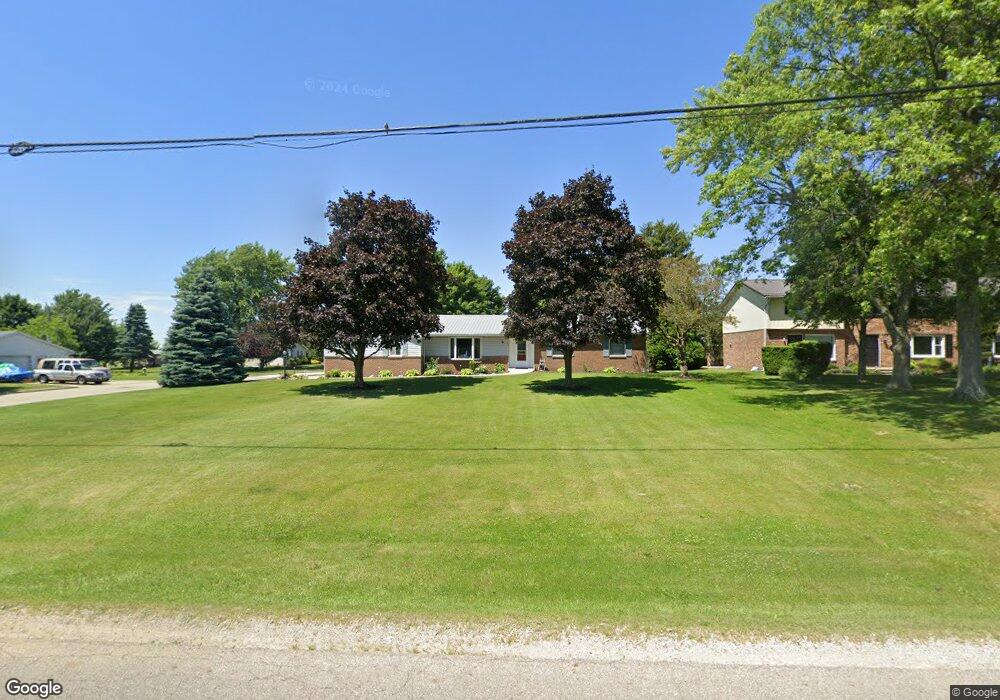
169 W Smiley Ave Shelby, OH 44875
Estimated Value: $220,000 - $233,000
3
Beds
2
Baths
1,594
Sq Ft
$141/Sq Ft
Est. Value
About This Home
This home is located at 169 W Smiley Ave, Shelby, OH 44875 and is currently estimated at $225,185, approximately $141 per square foot. 169 W Smiley Ave is a home located in Richland County with nearby schools including St. Mary's School.
Ownership History
Date
Name
Owned For
Owner Type
Purchase Details
Closed on
Jan 29, 2021
Sold by
Pfahler Andrea D
Bought by
Pfahler Charles B
Current Estimated Value
Purchase Details
Closed on
Aug 14, 2014
Sold by
Pfahler Charles B and Pfahler Andrea D
Bought by
Pfahler Charles B and Pfahler Andrea D
Home Financials for this Owner
Home Financials are based on the most recent Mortgage that was taken out on this home.
Original Mortgage
$63,000
Outstanding Balance
$47,951
Interest Rate
4.14%
Mortgage Type
New Conventional
Estimated Equity
$177,234
Purchase Details
Closed on
Mar 1, 1985
Create a Home Valuation Report for This Property
The Home Valuation Report is an in-depth analysis detailing your home's value as well as a comparison with similar homes in the area
Home Values in the Area
Average Home Value in this Area
Purchase History
| Date | Buyer | Sale Price | Title Company |
|---|---|---|---|
| Pfahler Charles B | -- | None Available | |
| Pfahler Charles B | -- | Barrister Title Group | |
| -- | $67,000 | -- |
Source: Public Records
Mortgage History
| Date | Status | Borrower | Loan Amount |
|---|---|---|---|
| Open | Pfahler Charles B | $63,000 |
Source: Public Records
Tax History Compared to Growth
Tax History
| Year | Tax Paid | Tax Assessment Tax Assessment Total Assessment is a certain percentage of the fair market value that is determined by local assessors to be the total taxable value of land and additions on the property. | Land | Improvement |
|---|---|---|---|---|
| 2024 | $2,231 | $58,390 | $10,500 | $47,890 |
| 2023 | $2,231 | $58,390 | $10,500 | $47,890 |
| 2022 | $2,183 | $51,110 | $9,390 | $41,720 |
| 2021 | $2,184 | $51,110 | $9,390 | $41,720 |
| 2020 | $2,186 | $51,110 | $9,390 | $41,720 |
| 2019 | $2,003 | $42,960 | $7,890 | $35,070 |
| 2018 | $1,984 | $42,960 | $7,890 | $35,070 |
| 2017 | $1,965 | $42,960 | $7,890 | $35,070 |
| 2016 | $1,972 | $43,400 | $6,960 | $36,440 |
| 2015 | $1,961 | $43,400 | $6,960 | $36,440 |
| 2014 | $1,895 | $43,400 | $6,960 | $36,440 |
| 2012 | $1,470 | $43,410 | $7,180 | $36,230 |
Source: Public Records
Map
Nearby Homes