Estimated Value: $747,000 - $807,000
5
Beds
2
Baths
3,535
Sq Ft
$218/Sq Ft
Est. Value
About This Home
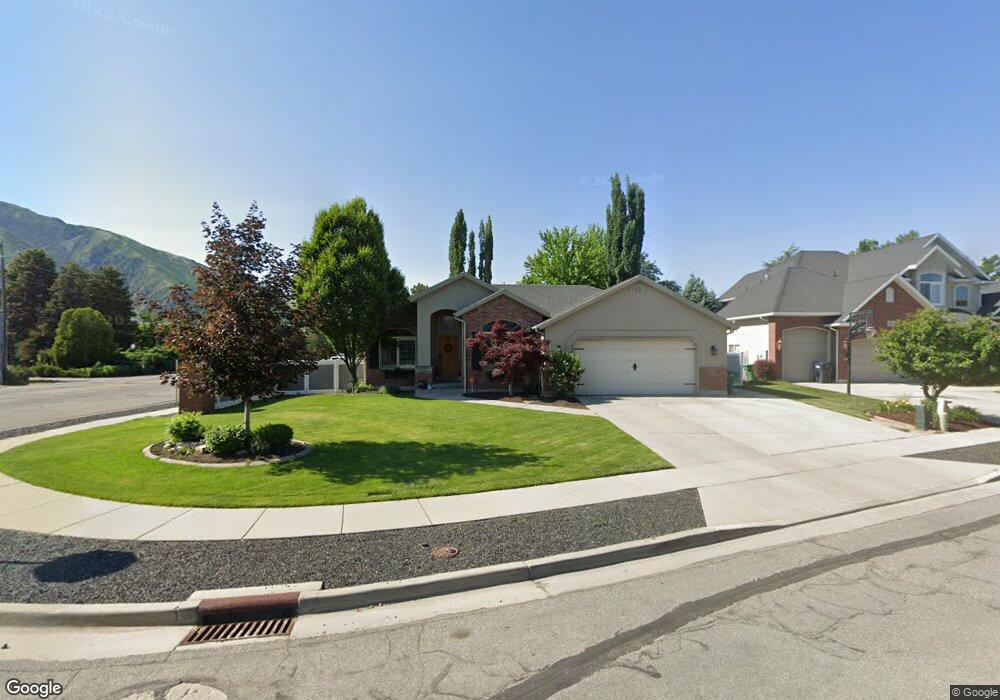
This home is located at 1690 Crescent View Cir, Sandy, UT 84092 and is currently estimated at $770,835, approximately $218 per square foot. 1690 Crescent View Cir is a home located in Salt Lake County with nearby schools including Sunrise Elementary School, Bell Canyon Montessori School, and Challenger School - Sandy.
Ownership History
Date
Name
Owned For
Owner Type
Purchase Details
Closed on
Feb 28, 2022
Sold by
Marchessault Glenda K
Bought by
Wall Kevin D and Wall Glenda Knight
Current Estimated Value
Purchase Details
Closed on
Feb 26, 2022
Sold by
Marchessault Glenda K
Bought by
Wall Kevin D and Wall Glenda Knight
Purchase Details
Closed on
Mar 2, 2020
Sold by
Marchessault Glenda K
Bought by
Marchessault Glenda K and Wall Kevin D
Home Financials for this Owner
Home Financials are based on the most recent Mortgage that was taken out on this home.
Original Mortgage
$306,000
Interest Rate
3.6%
Mortgage Type
New Conventional
Purchase Details
Closed on
Mar 28, 2012
Sold by
Cvt Properties Llc
Bought by
Marchessault Glenda
Purchase Details
Closed on
Oct 26, 2009
Sold by
Marchessault Glenda K
Bought by
Cvt Properties Llc
Purchase Details
Closed on
Jan 21, 2009
Sold by
Cvt Properties Llc
Bought by
Marchessault Glenda K
Purchase Details
Closed on
Feb 26, 2008
Sold by
Marchessault Glenda
Bought by
Cvt Properties Llc
Purchase Details
Closed on
Aug 26, 2005
Sold by
Neff Brent M and Neff Emily M
Bought by
Marchessault Glenda
Home Financials for this Owner
Home Financials are based on the most recent Mortgage that was taken out on this home.
Original Mortgage
$50,200
Interest Rate
5.64%
Mortgage Type
Credit Line Revolving
Purchase Details
Closed on
Jan 17, 2003
Sold by
Neff Brent M and Neff Emily M
Bought by
Neff Brent M and Neff Emily M
Home Financials for this Owner
Home Financials are based on the most recent Mortgage that was taken out on this home.
Original Mortgage
$185,000
Interest Rate
4.25%
Purchase Details
Closed on
Jan 4, 2002
Sold by
Neff Brent M and Neff Robert
Bought by
Neff Brent M and Neff Emily M
Home Financials for this Owner
Home Financials are based on the most recent Mortgage that was taken out on this home.
Original Mortgage
$155,000
Interest Rate
5.87%
Purchase Details
Closed on
Mar 13, 2001
Sold by
Neff Brent
Bought by
Neff Brent M and Robert Neff A
Purchase Details
Closed on
Mar 2, 2001
Sold by
Sunrise Capital Llc
Bought by
Neff Brent
Create a Home Valuation Report for This Property
The Home Valuation Report is an in-depth analysis detailing your home's value as well as a comparison with similar homes in the area
Home Values in the Area
Average Home Value in this Area
Purchase History
| Date | Buyer | Sale Price | Title Company |
|---|---|---|---|
| Wall Kevin D | -- | Artisan Title | |
| Wall Kevin D | -- | Artisan Title | |
| Marchessault Glenda K | -- | Artisan Title | |
| Marchessault Glenda | -- | None Available | |
| Cvt Properties Llc | -- | Canyon View Title Ins Agency | |
| Marchessault Glenda K | -- | Canyon View Title Ins Agency | |
| Cvt Properties Llc | -- | Canyon View Title Ins Agency | |
| Marchessault Glenda | -- | Canyon View Title Ins Agency | |
| Neff Brent M | -- | Backman Stewart Title Servic | |
| Neff Brent M | -- | Backman Stewart Title Servic | |
| Neff Brent M | -- | Backman Stewart Title Servic | |
| Neff Brent | -- | Backman Stewart Title Servic |
Source: Public Records
Mortgage History
| Date | Status | Borrower | Loan Amount |
|---|---|---|---|
| Previous Owner | Marchessault Glenda K | $306,000 | |
| Previous Owner | Marchessault Glenda | $50,200 | |
| Previous Owner | Marchessault Glenda | $268,000 | |
| Previous Owner | Neff Brent M | $185,000 | |
| Previous Owner | Neff Brent M | $155,000 |
Source: Public Records
Tax History
| Year | Tax Paid | Tax Assessment Tax Assessment Total Assessment is a certain percentage of the fair market value that is determined by local assessors to be the total taxable value of land and additions on the property. | Land | Improvement |
|---|---|---|---|---|
| 2025 | $3,914 | $703,800 | $331,000 | $372,800 |
| 2024 | $3,914 | $723,900 | $318,600 | $405,300 |
| 2023 | $3,499 | $645,300 | $306,400 | $338,900 |
| 2022 | $3,768 | $678,800 | $300,400 | $378,400 |
| 2021 | $3,405 | $522,200 | $270,100 | $252,100 |
| 2020 | $3,143 | $454,500 | $270,100 | $184,400 |
| 2019 | $3,169 | $446,600 | $254,800 | $191,800 |
| 2016 | $2,580 | $349,500 | $229,600 | $119,900 |
Source: Public Records
Map
Nearby Homes
- 1653 Crescent View Dr
- 11341 S Silver Buckle Way
- 11318 Canyon Falls Ln
- 11382 S Canyon Falls Ln
- 11343 Clifford Cir
- 1320 E Woodhill Cir
- 10868 Prescott Dr
- 1234 E Sandy Ridge Dr
- 11129 S 2125 E
- 11755 S Canberra Dr
- 1129 E Sanders Rd
- 2026 E 10765 S
- 2234 E Willow Brook Way
- 7 Rollingwood Ln
- 2192 E High Mesa Dr
- 10889 Granite Dr
- 11855 S Hidden Valley Dr
- 1074 E Black Forest Dr
- 2250 High Mountain Dr
- 2232 E Lone Eagle Ln
- 1690 Crescent View Cir Unit 1
- 1690 E Crescent View Cir
- 1678 Crescent View Dr
- 1678 Crescent View Cir
- 1678 Crescent View Cir Unit 2
- 1678 E Crescent View Cir
- 11301 S Blue Roan Ln
- 11301 Blue Roan Ln
- 11302 Blue Roan Ln
- 11302 S Blue Roan Ln
- 1666 Crescent View Cir
- 1689 E Crescent View Cir
- 1689 Crescent View Cir
- 1720 Crescent View Dr
- 1677 Crescent View Dr
- 1677 E Crescent View Cir
- 1677 Crescent View Cir
- 11314 S Blue Roan Ln
- 11314 Blue Roan Ln
- 11303 Four Sox Cove
Your Personal Tour Guide
Ask me questions while you tour the home.