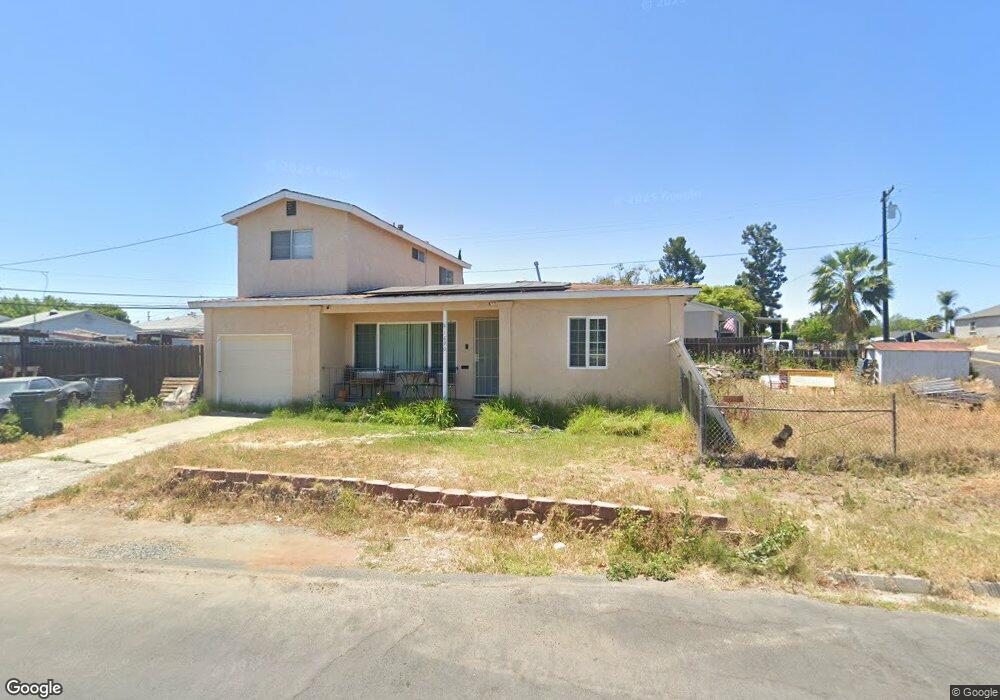
1690 Dupont Dr Lemon Grove, CA 91945
Estimated Value: $750,000 - $800,989
4
Beds
2
Baths
1,647
Sq Ft
$468/Sq Ft
Est. Value
About This Home
This home is located at 1690 Dupont Dr, Lemon Grove, CA 91945 and is currently estimated at $770,997, approximately $468 per square foot. 1690 Dupont Dr is a home located in San Diego County with nearby schools including Monterey Heights Elementary, Mount Miguel High School, and Lighthouse Christian Academy.
Ownership History
Date
Name
Owned For
Owner Type
Purchase Details
Closed on
Jan 20, 2018
Sold by
Allen James and Allen Donna
Bought by
Blue Marlon and Blue Atsuko
Current Estimated Value
Home Financials for this Owner
Home Financials are based on the most recent Mortgage that was taken out on this home.
Original Mortgage
$409,000
Outstanding Balance
$346,025
Interest Rate
4.04%
Mortgage Type
VA
Estimated Equity
$424,972
Purchase Details
Closed on
Mar 31, 2006
Sold by
Allen James and Allen Donna
Bought by
Allen James and Allen Donna
Purchase Details
Closed on
Nov 3, 1999
Sold by
Dillon Harry G and Dillon Ruth L
Bought by
Allen James and Allen Donna
Home Financials for this Owner
Home Financials are based on the most recent Mortgage that was taken out on this home.
Original Mortgage
$178,398
Interest Rate
7.95%
Mortgage Type
VA
Purchase Details
Closed on
Dec 17, 1998
Sold by
Berenter Jay Scott and Berenter Monica
Bought by
Greystone Homes Inc
Create a Home Valuation Report for This Property
The Home Valuation Report is an in-depth analysis detailing your home's value as well as a comparison with similar homes in the area
Home Values in the Area
Average Home Value in this Area
Purchase History
| Date | Buyer | Sale Price | Title Company |
|---|---|---|---|
| Blue Marlon | $409,000 | Fidelity National Title | |
| Allen James | -- | None Available | |
| Allen James | $175,000 | New Century Title Company | |
| Greystone Homes Inc | $785,000 | North American Title |
Source: Public Records
Mortgage History
| Date | Status | Borrower | Loan Amount |
|---|---|---|---|
| Open | Blue Marlon | $409,000 | |
| Previous Owner | Allen James | $178,398 |
Source: Public Records
Tax History Compared to Growth
Tax History
| Year | Tax Paid | Tax Assessment Tax Assessment Total Assessment is a certain percentage of the fair market value that is determined by local assessors to be the total taxable value of land and additions on the property. | Land | Improvement |
|---|---|---|---|---|
| 2025 | $4,134 | $465,364 | $150,922 | $314,442 |
| 2024 | $4,134 | $456,240 | $147,963 | $308,277 |
| 2023 | $4,099 | $447,295 | $145,062 | $302,233 |
| 2022 | $4,175 | $438,525 | $142,218 | $296,307 |
| 2021 | $5,816 | $429,928 | $139,430 | $290,498 |
| 2020 | $5,751 | $425,521 | $138,001 | $287,520 |
| 2019 | $5,660 | $417,179 | $135,296 | $281,883 |
| 2018 | $3,510 | $235,557 | $76,394 | $159,163 |
| 2017 | $150 | $230,940 | $74,897 | $156,043 |
| 2016 | $3,331 | $226,413 | $73,429 | $152,984 |
| 2015 | $3,313 | $223,014 | $72,327 | $150,687 |
| 2014 | $3,189 | $218,647 | $70,911 | $147,736 |
Source: Public Records
Map
Nearby Homes
- 1737-41 Glencoe Dr
- 1701 Dayton Dr
- 1630 Cameron Dr
- 1915 Englewood Dr
- 8046-48 Sarawak Dr
- 2030 Fairhaven St
- 1928 Noble St
- 1015 Harlan Cir
- 1795 Lemon Grove Ave
- 1607 Watwood Rd
- 1265 Darby St
- 2108 El Prado Ave
- 2240-42 El Prado Ave
- 1062 Armacost Rd
- 753 Jacumba St
- 612 Cardiff St
- 725 Peggy Dr
- 8154 Golden Ave
- 1942 Madera St
- 2674 Buena Vista Ave
- 7729 Canton Dr
- 1670 Dupont Dr Unit 72
- 7755 Canton Dr
- 7721 Canton Dr
- 1666 Dupont Dr Unit 68
- 1667 Elroy Dr
- 7730 Canton Dr
- 7767 Canton Dr
- 7760 Canton Dr
- 7705 Canton Dr
- 1655 Elroy Dr
- 1669 Dupont Dr Unit 71
- 1648 Dupont Dr
- 7720 Canton Dr
- 1701 Dupont Dr
- 1643 Elroy Dr
- 1655 Dupont Dr Unit 57
- 1712 Dupont Dr
- 7770 Canton Dr
- 7781 Canton Dr