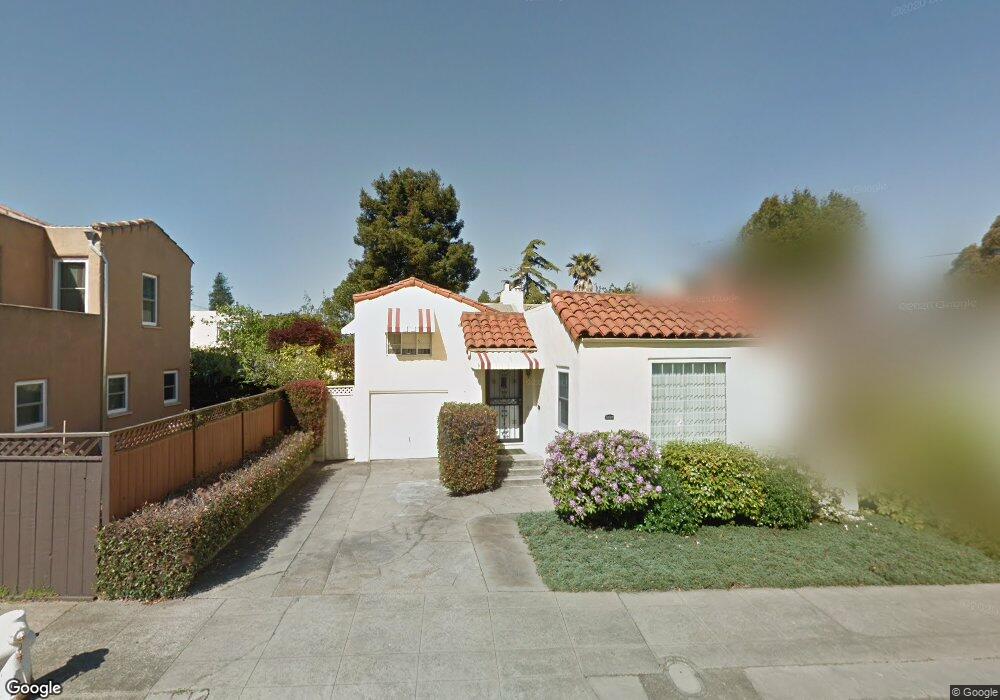
1690 Short St Berkeley, CA 94702
West Berkeley NeighborhoodEstimated Value: $1,608,000 - $1,854,473
2
Beds
2
Baths
1,933
Sq Ft
$908/Sq Ft
Est. Value
About This Home
This home is located at 1690 Short St, Berkeley, CA 94702 and is currently estimated at $1,754,618, approximately $907 per square foot. 1690 Short St is a home located in Alameda County with nearby schools including Ruth Acty Elementary, Berkeley Arts Magnet at Whittier School, and Rosa Parks Elementary School.
Ownership History
Date
Name
Owned For
Owner Type
Purchase Details
Closed on
Jan 7, 2019
Sold by
Moran Odis H and Moran Darline
Bought by
Cheng Lee Charles C H and Cheng Guo Shiang
Current Estimated Value
Home Financials for this Owner
Home Financials are based on the most recent Mortgage that was taken out on this home.
Original Mortgage
$1,050,000
Outstanding Balance
$926,874
Interest Rate
4.8%
Mortgage Type
New Conventional
Estimated Equity
$827,744
Purchase Details
Closed on
Jun 19, 2018
Sold by
Moran Odis H and Odis Moran Living Trust
Bought by
Moran Odis H and Moran Darline
Home Financials for this Owner
Home Financials are based on the most recent Mortgage that was taken out on this home.
Original Mortgage
$755,000
Interest Rate
4.5%
Mortgage Type
New Conventional
Purchase Details
Closed on
Aug 6, 1996
Sold by
Moran Odis
Bought by
Moran Odis and The Odis Moran Living Trust
Create a Home Valuation Report for This Property
The Home Valuation Report is an in-depth analysis detailing your home's value as well as a comparison with similar homes in the area
Home Values in the Area
Average Home Value in this Area
Purchase History
| Date | Buyer | Sale Price | Title Company |
|---|---|---|---|
| Cheng Lee Charles C H | $1,400,000 | Chicago Title Company | |
| Moran Odis H | -- | Old Republic Title Company | |
| Moran Odis | -- | -- |
Source: Public Records
Mortgage History
| Date | Status | Borrower | Loan Amount |
|---|---|---|---|
| Open | Cheng Lee Charles C H | $1,050,000 | |
| Previous Owner | Moran Odis H | $755,000 |
Source: Public Records
Tax History
| Year | Tax Paid | Tax Assessment Tax Assessment Total Assessment is a certain percentage of the fair market value that is determined by local assessors to be the total taxable value of land and additions on the property. | Land | Improvement |
|---|---|---|---|---|
| 2025 | $22,167 | $1,561,700 | $468,510 | $1,093,190 |
| 2024 | $22,167 | $1,531,081 | $459,324 | $1,071,757 |
| 2023 | $21,672 | $1,501,065 | $450,319 | $1,050,746 |
| 2022 | $21,275 | $1,471,637 | $441,491 | $1,030,146 |
| 2021 | $21,363 | $1,442,783 | $432,835 | $1,009,948 |
| 2020 | $20,360 | $1,428,000 | $428,400 | $999,600 |
| 2019 | $3,542 | $79,430 | $36,336 | $43,094 |
| 2018 | $3,615 | $77,872 | $35,623 | $42,249 |
| 2017 | $3,456 | $76,346 | $34,925 | $41,421 |
| 2016 | $3,212 | $74,849 | $34,240 | $40,609 |
| 2015 | $3,141 | $73,725 | $33,726 | $39,999 |
| 2014 | $3,059 | $72,280 | $33,065 | $39,215 |
Source: Public Records
Map
Nearby Homes
- 1482 Lincoln St
- 1564 Sacramento St
- 1436 Delaware St
- 1322 Virginia St
- 1813 Sacramento St
- 1411 Hearst Ave Unit 2
- 1512 Hearst Ave Unit 1512
- 1929 California St
- 1728 Curtis St
- 1360 Acton St
- 1919 Curtis St
- 1450 Curtis St
- 1128 Delaware St
- 2118 California St
- 1609 Kains Ave
- 1447 Kains Ave
- 2218 -2222 Grant St
- 1504 10th St
- 2221 McGee Ave
- 2304 Edwards St
- 1680 Short St
- 1451 Virginia St
- 1461 Virginia St
- 1670 Short St
- 1445 Virginia St
- 1428 Lincoln St
- 1426 Lincoln St
- 1437 Virginia St
- 1660 Short St
- 1685 Short St
- 1693 Short St
- 1675 Short St
- 1431 Virginia St
- 1481 Virginia St
- 1667 Short St
- 1424 Lincoln St
- 1460 Lincoln St
- 1440 Lincoln St
- 1661 Short St
- 1425 Virginia St