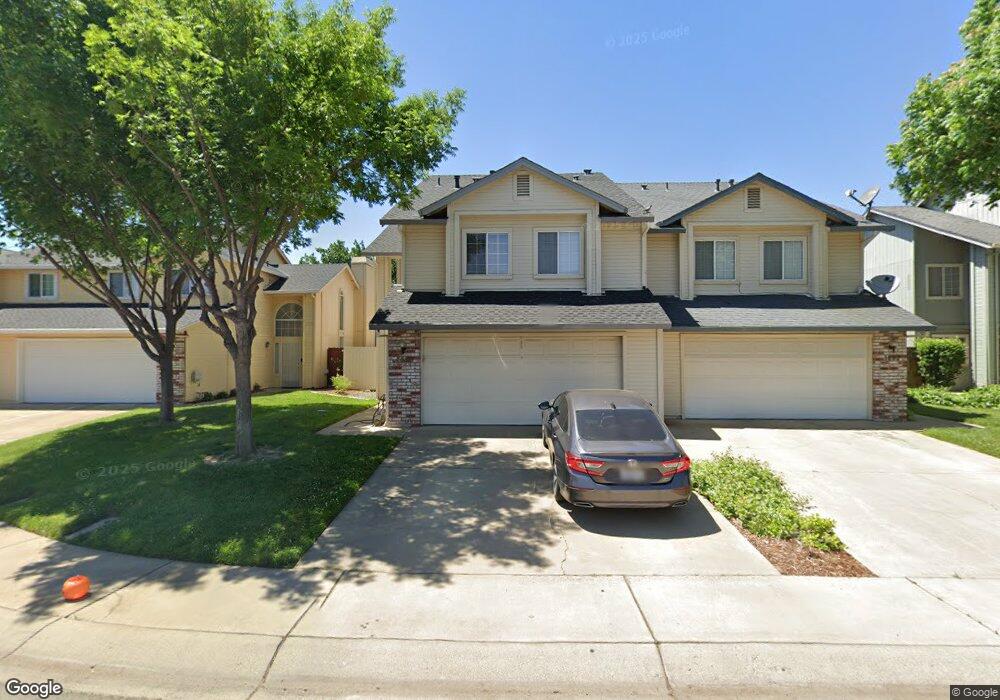
1690 Wildflower Cir Yuba City, CA 95993
Estimated Value: $254,000 - $380,000
3
Beds
3
Baths
1,346
Sq Ft
$246/Sq Ft
Est. Value
About This Home
This home is located at 1690 Wildflower Cir, Yuba City, CA 95993 and is currently estimated at $331,271, approximately $246 per square foot. 1690 Wildflower Cir is a home located in Sutter County with nearby schools including Andros Karperos, River Valley High School, and Pathways Charter Academy.
Ownership History
Date
Name
Owned For
Owner Type
Purchase Details
Closed on
Jul 11, 2019
Sold by
Bansal Amarjit S
Bought by
Bansal Amarjit S and Bansal Living Trust
Current Estimated Value
Purchase Details
Closed on
Jun 22, 2009
Sold by
Bansal Ramesh K
Bought by
Bansal Amarjit S
Home Financials for this Owner
Home Financials are based on the most recent Mortgage that was taken out on this home.
Original Mortgage
$87,000
Outstanding Balance
$55,145
Interest Rate
4.83%
Mortgage Type
New Conventional
Estimated Equity
$276,126
Purchase Details
Closed on
Jun 18, 2002
Sold by
Carlin Jerome E
Bought by
Bansal Amarjit S and Bansal Ramesh K
Home Financials for this Owner
Home Financials are based on the most recent Mortgage that was taken out on this home.
Original Mortgage
$94,400
Interest Rate
6.74%
Create a Home Valuation Report for This Property
The Home Valuation Report is an in-depth analysis detailing your home's value as well as a comparison with similar homes in the area
Home Values in the Area
Average Home Value in this Area
Purchase History
| Date | Buyer | Sale Price | Title Company |
|---|---|---|---|
| Bansal Amarjit S | -- | None Available | |
| Bansal Amarjit S | -- | North State Title Company | |
| Bansal Amarjit S | $118,000 | First American Title Ins Co |
Source: Public Records
Mortgage History
| Date | Status | Borrower | Loan Amount |
|---|---|---|---|
| Open | Bansal Amarjit S | $87,000 | |
| Closed | Bansal Amarjit S | $94,400 |
Source: Public Records
Tax History Compared to Growth
Tax History
| Year | Tax Paid | Tax Assessment Tax Assessment Total Assessment is a certain percentage of the fair market value that is determined by local assessors to be the total taxable value of land and additions on the property. | Land | Improvement |
|---|---|---|---|---|
| 2025 | $1,867 | $174,295 | $29,533 | $144,762 |
| 2024 | $1,867 | $170,878 | $28,954 | $141,924 |
| 2023 | $1,867 | $167,529 | $28,387 | $139,142 |
| 2022 | $1,803 | $164,245 | $27,831 | $136,414 |
| 2021 | $2,307 | $161,047 | $27,296 | $133,751 |
| 2020 | $2,278 | $159,396 | $27,016 | $132,380 |
| 2019 | $2,238 | $156,271 | $26,487 | $129,784 |
| 2018 | $2,203 | $153,206 | $25,967 | $127,239 |
| 2017 | $2,160 | $150,202 | $25,458 | $124,744 |
| 2016 | $2,125 | $147,257 | $24,959 | $122,298 |
| 2015 | $2,096 | $145,045 | $24,584 | $120,461 |
| 2014 | $2,067 | $142,203 | $24,102 | $118,101 |
Source: Public Records
Map
Nearby Homes
- 683 Mark Thomas Dr
- 1781 Franklin Rd Unit 36
- 1781 Franklin Rd Unit 59
- 1923 Hardial Dr
- 138 Nantucket Way
- 430 Neil Dr
- 152 College Hill Way
- 170 Nantucket Way
- 156 Bristol Way
- 1665 Michelle Dr
- 0 Lassen Blvd
- 955 Carson Dr
- 1955 Jason Ct
- 238 Anita Way
- 1514 Countryside Dr
- 1344 Kean Ave
- 1330 Kean Ave
- 1545 Camino Del Oro
- 1571 Holly Tree Dr
- 4520 Us-99
- 1684 Wildflower Cir
- 1692 Wildflower Cir
- 1696 Wildflower Cir
- 1682 Wildflower Cir
- 1698 Wildflower Cir
- 509 Willowbrook Dr
- 517 Willowbrook Dr
- 1678 Wildflower Cir
- 501 Willowbrook Dr
- 525 Willowbrook Dr
- 1704 Wildflower Cir
- 1676 Wildflower Cir
- 1691 Wildflower Cir
- 1693 Wildflower Cir Unit 1
- 1693 Wildflower Cir
- 1670 Wildflower Cir
- 1697 Wildflower Cir
- 533 Willowbrook Dr
- 1706 Wildflower Cir
- 1668 Wildflower Cir Unit 1