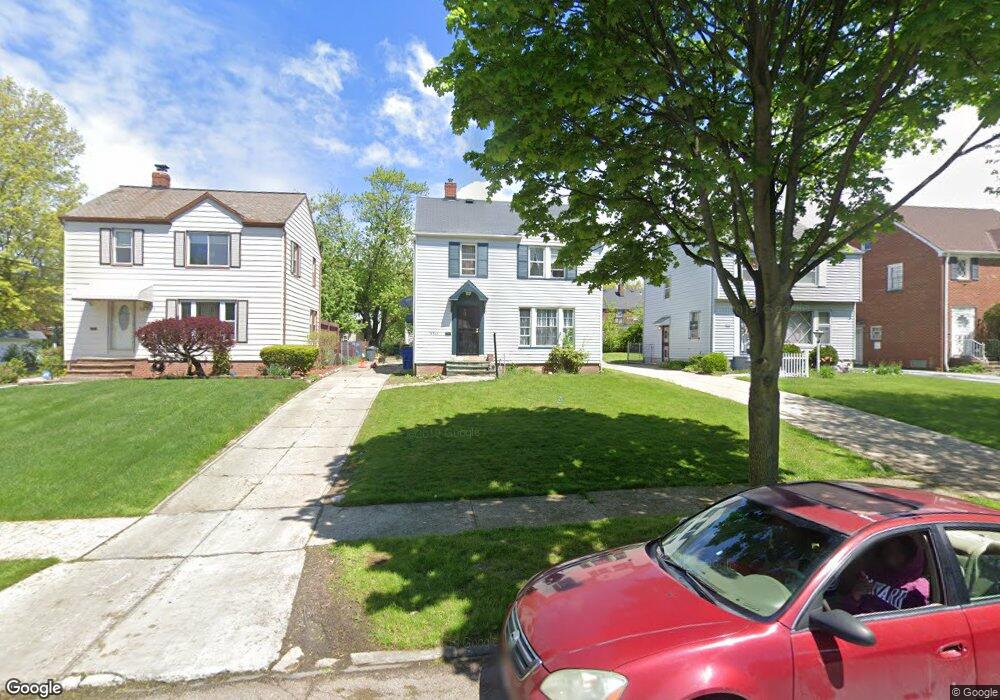
16905 Biltmore Ave Cleveland, OH 44128
Lee-Miles NeighborhoodEstimated Value: $54,000 - $115,000
3
Beds
1
Bath
1,144
Sq Ft
$71/Sq Ft
Est. Value
About This Home
This home is located at 16905 Biltmore Ave, Cleveland, OH 44128 and is currently estimated at $81,760, approximately $71 per square foot. 16905 Biltmore Ave is a home located in Cuyahoga County with nearby schools including Adlai Stevenson School, Andrew J. Rickoff School, and Bolton.
Ownership History
Date
Name
Owned For
Owner Type
Purchase Details
Closed on
Jul 8, 2024
Sold by
Sheriff Of Cuyahoga County
Bought by
West Management Realty Group Llc
Current Estimated Value
Purchase Details
Closed on
Sep 20, 2021
Sold by
Roberts Milford P
Bought by
Green Marsha Renee
Purchase Details
Closed on
Mar 29, 2005
Sold by
Roberts Milford P and Green Marsha Renee
Bought by
Roberts Milford P and Green Marsha Renee
Home Financials for this Owner
Home Financials are based on the most recent Mortgage that was taken out on this home.
Original Mortgage
$89,100
Interest Rate
5.64%
Mortgage Type
New Conventional
Purchase Details
Closed on
Aug 21, 2001
Sold by
Roberts Eugene and Roberts Lelia M
Bought by
Roberts Milford P and Green Marsha Renee
Purchase Details
Closed on
Apr 2, 1985
Sold by
Roberts Eugene and Roberts Lelia M
Bought by
Robets Eugene and Robets Lelia M
Purchase Details
Closed on
Jan 1, 1975
Bought by
Roberts Eugene and Roberts Lelia M
Create a Home Valuation Report for This Property
The Home Valuation Report is an in-depth analysis detailing your home's value as well as a comparison with similar homes in the area
Home Values in the Area
Average Home Value in this Area
Purchase History
| Date | Buyer | Sale Price | Title Company |
|---|---|---|---|
| West Management Realty Group Llc | $59,441 | None Listed On Document | |
| Green Marsha Renee | -- | Heights Title | |
| Roberts Milford P | -- | Tower City Title Agency L | |
| Roberts Milford P | -- | -- | |
| Robets Eugene | -- | -- | |
| Roberts Eugene | -- | -- |
Source: Public Records
Mortgage History
| Date | Status | Borrower | Loan Amount |
|---|---|---|---|
| Previous Owner | Roberts Milford P | $89,100 |
Source: Public Records
Tax History Compared to Growth
Tax History
| Year | Tax Paid | Tax Assessment Tax Assessment Total Assessment is a certain percentage of the fair market value that is determined by local assessors to be the total taxable value of land and additions on the property. | Land | Improvement |
|---|---|---|---|---|
| 2024 | $1,542 | $33,320 | $8,155 | $25,165 |
| 2023 | $1,513 | $29,120 | $7,280 | $21,840 |
| 2022 | $1,536 | $29,120 | $7,280 | $21,840 |
| 2021 | $1,521 | $29,120 | $7,280 | $21,840 |
| 2020 | $1,394 | $24,890 | $6,230 | $18,660 |
| 2019 | $1,289 | $71,100 | $17,800 | $53,300 |
| 2018 | $1,179 | $24,890 | $6,230 | $18,660 |
| 2017 | $1,083 | $21,880 | $7,700 | $14,180 |
| 2016 | $1,074 | $21,880 | $7,700 | $14,180 |
| 2015 | $1,044 | $21,880 | $7,700 | $14,180 |
| 2014 | $1,044 | $21,460 | $7,560 | $13,900 |
Source: Public Records
Map
Nearby Homes
- 17015 Stockbridge Ave
- 16702 Glendale Ave
- 17016 Talford Ave
- 16915 Talford Ave
- 17120 Talford Ave
- 17302 Glendale Ave
- 17312 Glendale Ave
- 17020 Eldamere Ave
- 17008 Throckley Ave
- 17104 Throckley Ave
- 17211 Walden Ave
- 17215 Harvard Ave
- 17415 Talford Ave
- 3927 E 176th St
- 17425 Walden Ave
- 17416 Throckley Ave
- 3947 E 176th St
- 17604 Walden Ave
- 3938 E 177th St
- 3983 E 176th St
- 16909 Biltmore Ave
- 16901 Biltmore Ave
- 16913 Biltmore Ave
- 16917 Biltmore Ave
- 16815 Biltmore Ave
- 16908 Glendale Ave
- 16902 Glendale Ave
- 16912 Glendale Ave
- 16916 Glendale Ave
- 17001 Biltmore Ave
- 16811 Biltmore Ave
- 16908 Biltmore Ave
- 16910 Biltmore Ave
- 16900 Biltmore Ave
- 16816 Glendale Ave
- 16914 Biltmore Ave
- 16807 Biltmore Ave
- 17005 Biltmore Ave
- 17002 Glendale Ave
- 16918 Biltmore Ave