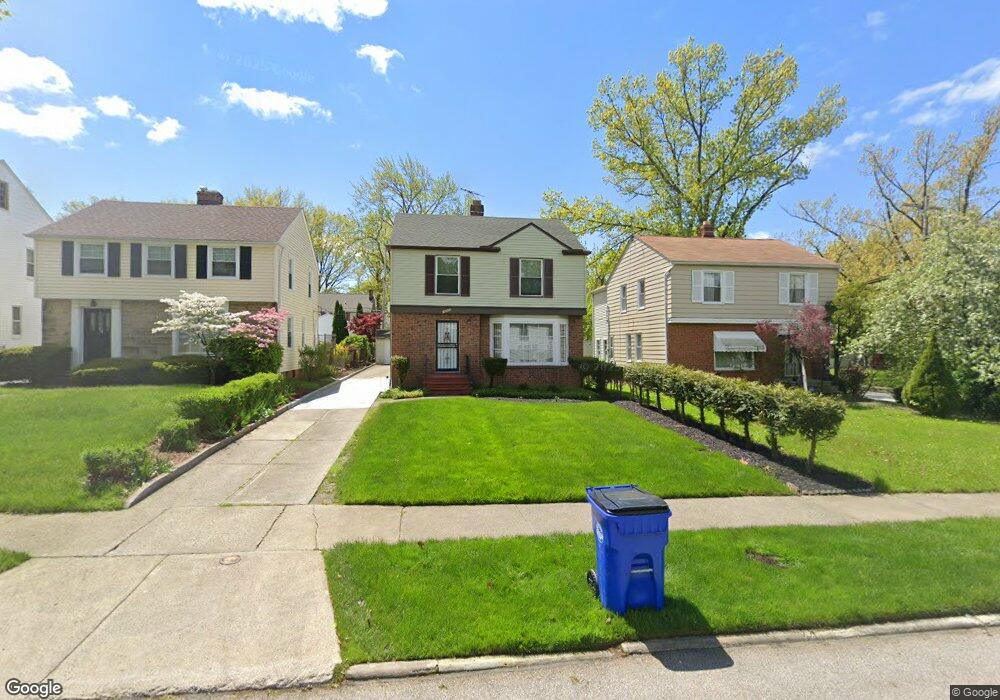
16908 Throckley Ave Cleveland, OH 44128
Lee-Miles NeighborhoodEstimated Value: $100,000 - $121,000
3
Beds
2
Baths
1,369
Sq Ft
$82/Sq Ft
Est. Value
About This Home
This home is located at 16908 Throckley Ave, Cleveland, OH 44128 and is currently estimated at $112,261, approximately $82 per square foot. 16908 Throckley Ave is a home located in Cuyahoga County with nearby schools including Adlai Stevenson School, Andrew J. Rickoff School, and Bolton.
Ownership History
Date
Name
Owned For
Owner Type
Purchase Details
Closed on
Sep 22, 2023
Sold by
Boccieri Brian J and Boccieri Brittany A
Bought by
Loa Properties Llc
Current Estimated Value
Home Financials for this Owner
Home Financials are based on the most recent Mortgage that was taken out on this home.
Original Mortgage
$120,000
Outstanding Balance
$117,455
Interest Rate
6.96%
Mortgage Type
New Conventional
Estimated Equity
-$5,194
Purchase Details
Closed on
Mar 7, 2023
Sold by
Davis Jack
Bought by
Boccieri Brian J
Purchase Details
Closed on
May 31, 2011
Sold by
Woodland Barbara and Davis Jack
Bought by
Davis Jack
Purchase Details
Closed on
Jul 28, 2010
Sold by
Woodland Barbara
Bought by
Woodland Barbara and Davis Jack
Purchase Details
Closed on
Apr 17, 2010
Sold by
Davis Jack
Bought by
Woodland Barbara
Purchase Details
Closed on
Jan 1, 1975
Bought by
Davis Jack
Create a Home Valuation Report for This Property
The Home Valuation Report is an in-depth analysis detailing your home's value as well as a comparison with similar homes in the area
Home Values in the Area
Average Home Value in this Area
Purchase History
| Date | Buyer | Sale Price | Title Company |
|---|---|---|---|
| Loa Properties Llc | -- | Terra Blue Title | |
| Boccieri Brian J | $65,000 | Terra Blue Title | |
| Davis Jack | $40,450 | Attorney | |
| Woodland Barbara | -- | Attorney | |
| Woodland Barbara | $80,900 | Attorney | |
| Davis Jack | -- | -- |
Source: Public Records
Mortgage History
| Date | Status | Borrower | Loan Amount |
|---|---|---|---|
| Open | Loa Properties Llc | $120,000 |
Source: Public Records
Tax History Compared to Growth
Tax History
| Year | Tax Paid | Tax Assessment Tax Assessment Total Assessment is a certain percentage of the fair market value that is determined by local assessors to be the total taxable value of land and additions on the property. | Land | Improvement |
|---|---|---|---|---|
| 2024 | $2,624 | $39,235 | $8,015 | $31,220 |
| 2023 | $2,385 | $31,440 | $7,180 | $24,260 |
| 2022 | $2,371 | $31,430 | $7,180 | $24,260 |
| 2021 | $2,347 | $31,430 | $7,180 | $24,260 |
| 2020 | $2,319 | $26,850 | $6,130 | $20,720 |
| 2019 | $2,144 | $76,700 | $17,500 | $59,200 |
| 2018 | $2,076 | $26,850 | $6,130 | $20,720 |
| 2017 | $2,032 | $24,640 | $7,560 | $17,080 |
| 2016 | $2,016 | $24,640 | $7,560 | $17,080 |
| 2015 | $1,983 | $24,640 | $7,560 | $17,080 |
| 2014 | $1,983 | $24,150 | $7,420 | $16,730 |
Source: Public Records
Map
Nearby Homes
- 17008 Throckley Ave
- 17104 Throckley Ave
- 16915 Talford Ave
- 17016 Talford Ave
- 17211 Walden Ave
- 17120 Talford Ave
- 16805 Scottsdale Blvd
- 16702 Glendale Ave
- 3716 Rolliston Rd
- 17416 Throckley Ave
- 16317 Throckley Ave
- 17302 Glendale Ave
- 16321 Invermere Ave
- 17415 Talford Ave
- 17425 Walden Ave
- 17312 Glendale Ave
- 17426 Invermere Ave
- 17511 Throckley Ave
- 17015 Stockbridge Ave
- 16314 Scottsdale Blvd
- 16912 Throckley Ave
- 16904 Throckley Ave
- 16916 Throckley Ave
- 16920 Throckley Ave
- 16907 Walden Ave
- 16911 Walden Ave
- 16903 Walden Ave
- 16915 Walden Ave
- 16812 Throckley Ave
- 16919 Walden Ave
- 16815 Walden Ave
- 16907 Throckley Ave
- 16911 Throckley Ave
- 16903 Throckley Ave
- 16915 Throckley Ave
- 17003 Walden Ave
- 16808 Throckley Ave
- 16919 Throckley Ave
- 16815 Throckley Ave
- 17007 Walden Ave