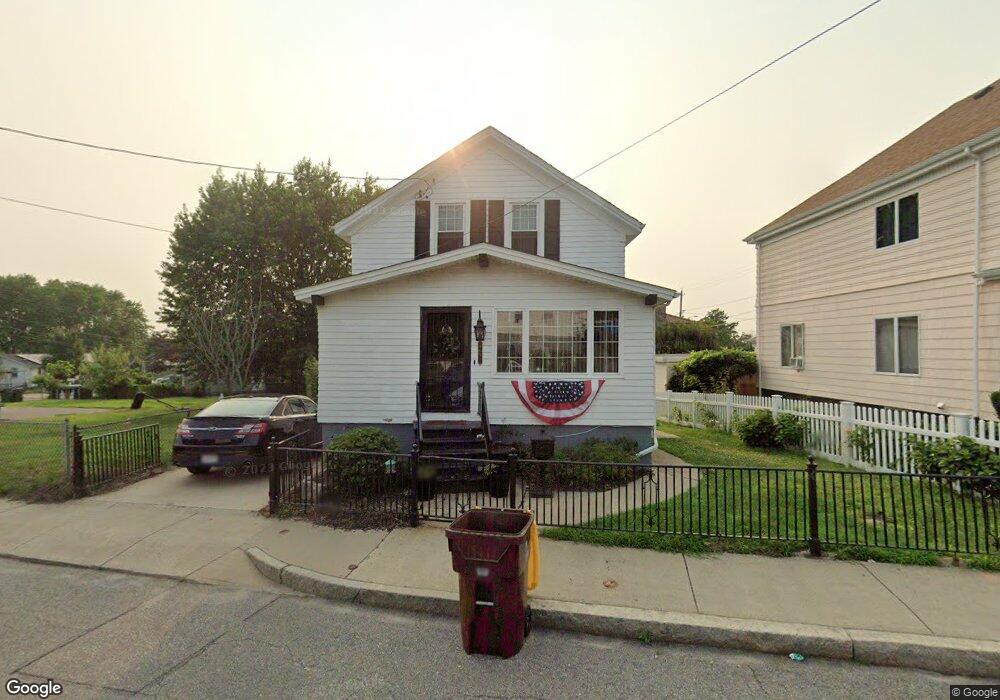
1691 Bay St Fall River, MA 02724
Sandy Beach NeighborhoodEstimated Value: $355,000 - $401,000
4
Beds
2
Baths
1,162
Sq Ft
$324/Sq Ft
Est. Value
About This Home
This home is located at 1691 Bay St, Fall River, MA 02724 and is currently estimated at $376,496, approximately $324 per square foot. 1691 Bay St is a home located in Bristol County with nearby schools including Carlton M. Viveiros Elementary School, Matthew J. Kuss Middle School, and B M C Durfee High School.
Ownership History
Date
Name
Owned For
Owner Type
Purchase Details
Closed on
Oct 15, 2019
Sold by
Correira Albert Est and Anselmo
Bought by
Costa Edward
Current Estimated Value
Home Financials for this Owner
Home Financials are based on the most recent Mortgage that was taken out on this home.
Original Mortgage
$229,761
Outstanding Balance
$199,496
Interest Rate
3.5%
Mortgage Type
FHA
Estimated Equity
$177,000
Purchase Details
Closed on
Sep 25, 1969
Bought by
Correira Albert
Create a Home Valuation Report for This Property
The Home Valuation Report is an in-depth analysis detailing your home's value as well as a comparison with similar homes in the area
Home Values in the Area
Average Home Value in this Area
Purchase History
| Date | Buyer | Sale Price | Title Company |
|---|---|---|---|
| Costa Edward | $234,000 | -- | |
| Correira Albert | -- | -- |
Source: Public Records
Mortgage History
| Date | Status | Borrower | Loan Amount |
|---|---|---|---|
| Open | Costa Edward | $229,761 |
Source: Public Records
Tax History Compared to Growth
Tax History
| Year | Tax Paid | Tax Assessment Tax Assessment Total Assessment is a certain percentage of the fair market value that is determined by local assessors to be the total taxable value of land and additions on the property. | Land | Improvement |
|---|---|---|---|---|
| 2025 | $3,445 | $300,900 | $123,400 | $177,500 |
| 2024 | $3,259 | $283,600 | $118,700 | $164,900 |
| 2023 | $3,015 | $245,700 | $101,800 | $143,900 |
| 2022 | $2,785 | $220,700 | $92,500 | $128,200 |
| 2021 | $2,604 | $188,300 | $85,600 | $102,700 |
| 2020 | $2,604 | $180,200 | $81,900 | $98,300 |
| 2019 | $2,496 | $171,200 | $78,000 | $93,200 |
| 2018 | $2,357 | $161,200 | $76,600 | $84,600 |
| 2017 | $2,267 | $161,900 | $78,100 | $83,800 |
| 2016 | $2,196 | $161,100 | $81,400 | $79,700 |
| 2015 | $2,119 | $162,000 | $78,300 | $83,700 |
| 2014 | $2,091 | $166,200 | $82,500 | $83,700 |
Source: Public Records
Map
Nearby Homes
- 66 Bailey St
- 616 Woodman St
- 391 Clarkson St
- 126 Wheeler St
- 310 King Philip St
- 579 Summit St Unit 3
- 579 Summit St Unit 2
- 2229 S Main St
- 245 Dwelly St
- 609 King Philip St
- 39 Hilton St
- 15 Higgins St
- 644-648 King Philip St
- 321 King St
- 1852 S Main St
- 1846 S Main St
- 636-644 Dwelly St
- 76 Church St
- 24 Hall St
- 27 Vista Way