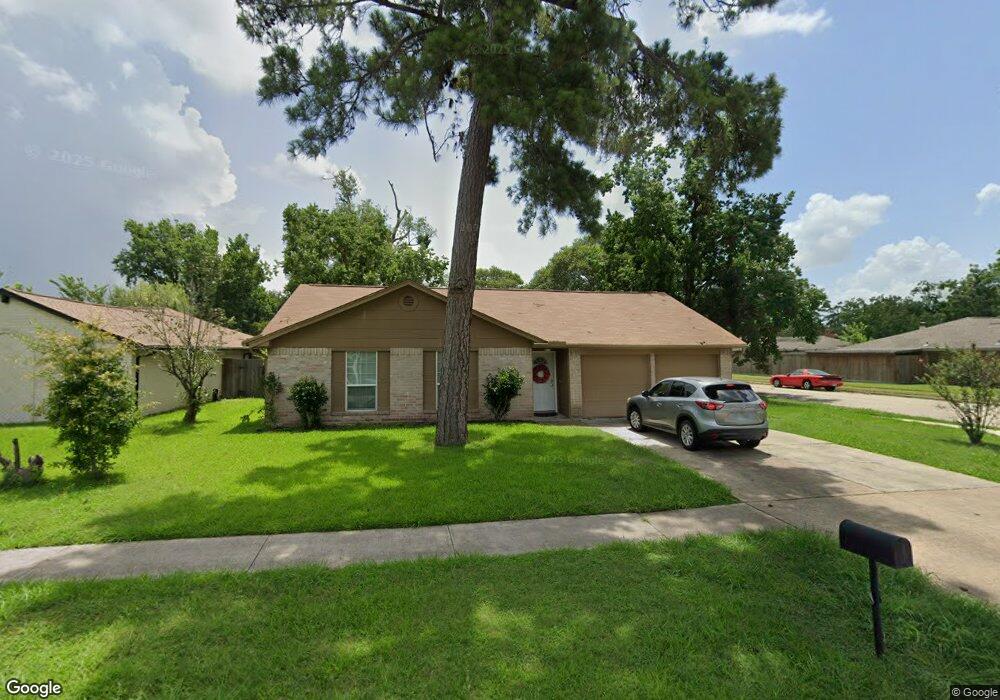
16911 Gleneagle Dr N Conroe, TX 77385
Estimated Value: $196,046 - $235,000
3
Beds
2
Baths
1,217
Sq Ft
$177/Sq Ft
Est. Value
About This Home
This home is located at 16911 Gleneagle Dr N, Conroe, TX 77385 and is currently estimated at $216,012, approximately $177 per square foot. 16911 Gleneagle Dr N is a home located in Montgomery County with nearby schools including Oak Ridge Elementary School, Irons J High School, and Vogel Intermediate School.
Ownership History
Date
Name
Owned For
Owner Type
Purchase Details
Closed on
Feb 2, 2018
Sold by
Mccaffrey Jonathan T
Bought by
Zosel Frederick and Zosel Cristina
Current Estimated Value
Purchase Details
Closed on
Apr 23, 2010
Sold by
Epperson Nanette S and Epperson Michael S
Bought by
Mccaffrey Jonathan T
Purchase Details
Closed on
Jan 20, 1999
Sold by
Morehouse Paul and Morehouse Gerri
Bought by
Mccafffrey Jonathan
Home Financials for this Owner
Home Financials are based on the most recent Mortgage that was taken out on this home.
Original Mortgage
$39,150
Interest Rate
6.66%
Purchase Details
Closed on
Jan 15, 1999
Sold by
Morehouse Paul Hubert and Morehouse Gerri Ruth
Bought by
Epperson Michael S and Epperson Nanette S
Home Financials for this Owner
Home Financials are based on the most recent Mortgage that was taken out on this home.
Original Mortgage
$39,150
Interest Rate
6.66%
Purchase Details
Closed on
Sep 1, 1982
Bought by
Mccafffrey Jonathan
Create a Home Valuation Report for This Property
The Home Valuation Report is an in-depth analysis detailing your home's value as well as a comparison with similar homes in the area
Home Values in the Area
Average Home Value in this Area
Purchase History
| Date | Buyer | Sale Price | Title Company |
|---|---|---|---|
| Zosel Frederick | -- | Chicago Title | |
| Mccaffrey Jonathan T | -- | First American Title | |
| Mccafffrey Jonathan | -- | -- | |
| Epperson Michael S | -- | First Surety Title Company | |
| Mccafffrey Jonathan | -- | -- |
Source: Public Records
Mortgage History
| Date | Status | Borrower | Loan Amount |
|---|---|---|---|
| Previous Owner | Epperson Michael S | $39,150 |
Source: Public Records
Tax History
| Year | Tax Paid | Tax Assessment Tax Assessment Total Assessment is a certain percentage of the fair market value that is determined by local assessors to be the total taxable value of land and additions on the property. | Land | Improvement |
|---|---|---|---|---|
| 2025 | $3,537 | $153,702 | $33,075 | $120,627 |
| 2024 | $3,537 | $159,263 | $33,075 | $126,188 |
| 2023 | $3,646 | $164,070 | $33,080 | $130,990 |
| 2022 | $3,216 | $156,790 | $33,080 | $123,710 |
| 2021 | $3,253 | $124,700 | $33,080 | $91,620 |
| 2020 | $3,397 | $123,160 | $33,080 | $90,080 |
| 2019 | $3,049 | $105,690 | $18,590 | $87,100 |
| 2018 | $2,822 | $97,840 | $18,590 | $79,250 |
| 2017 | $2,866 | $97,540 | $18,590 | $79,250 |
| 2016 | $2,606 | $88,670 | $18,590 | $70,080 |
| 2015 | $2,074 | $83,660 | $18,590 | $73,860 |
| 2014 | $2,074 | $76,050 | $18,590 | $59,370 |
Source: Public Records
Map
Nearby Homes
- 9809 Wren Ct
- 16937 Larkspur
- 16947 Hummingbird
- 16731 Foursquare Dr
- 16820 Infield Ct
- 16945 Scenic Knoll
- 16870 Blackberry Lily Ln
- 102 Wimberly Way
- 74 Wimberly Way
- 27 Harmony Hollow Ct
- 9838 Bobolink Dr
- 203 Fairwind Trail Dr
- 17135 Sprawling Oaks Dr
- 9915 Valance Way
- 9906 Knob Hollow Way
- 7 Raindance Ct
- 251 N Wimberly Way
- 6342 Big Oaks Dr
- 9934 Yearling Place
- 16758 N Blue Jay Dr
- 16911 Gleneagle Dr N Unit 77385
- 16911 Gleneagle Dr N Unit 7738
- 16907 Gleneagle Dr N
- 9805 Wren Ct
- 0 Gleneagle
- 16917 Glen Eagle Dr N
- 16917 Gleneagle Dr N
- 16903 Gleneagle Dr N
- 9804 Wren Ct
- 16921 Gleneagle Dr N
- 9806 Toucan Ln
- 16899 Gleneagle Dr N
- 16910 Gleneagle Dr N
- 16906 Gleneagle Dr N
- 16914 Gleneagle Dr N
- 9810 Toucan Ln
- 16902 Gleneagle Dr N
- 9808 Wren Ct
- 16918 Gleneagle Dr N
- 16925 Gleneagle Dr N
Your Personal Tour Guide
Ask me questions while you tour the home.