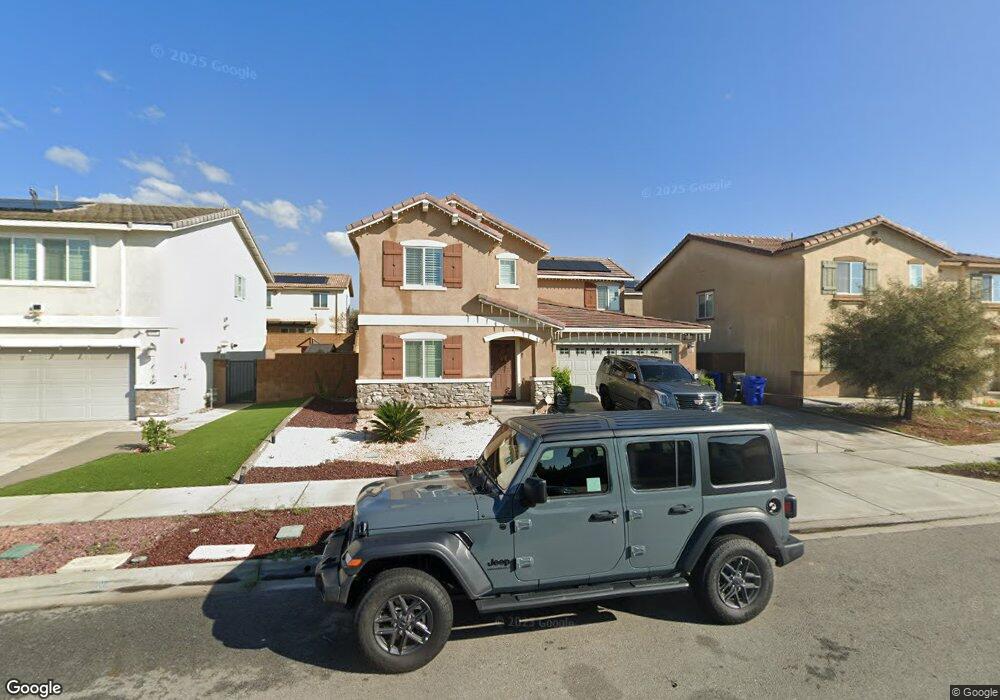
16924 Backwater Ln Fontana, CA 92336
Estimated Value: $697,274 - $742,000
4
Beds
3
Baths
2,206
Sq Ft
$329/Sq Ft
Est. Value
About This Home
This home is located at 16924 Backwater Ln, Fontana, CA 92336 and is currently estimated at $726,319, approximately $329 per square foot. 16924 Backwater Ln is a home with nearby schools including Mango Elementary School, Wayne Ruble Middle School, and Fontana A. B. Miller High School.
Ownership History
Date
Name
Owned For
Owner Type
Purchase Details
Closed on
Aug 1, 2019
Sold by
Uribe Andrew and Corona Jesus A
Bought by
Corona Isaura L and Uribe Andrew
Current Estimated Value
Home Financials for this Owner
Home Financials are based on the most recent Mortgage that was taken out on this home.
Original Mortgage
$431,420
Outstanding Balance
$379,155
Interest Rate
3.87%
Mortgage Type
FHA
Estimated Equity
$347,164
Purchase Details
Closed on
May 8, 2018
Sold by
Corona Isaura I
Bought by
Uribe Andrew
Home Financials for this Owner
Home Financials are based on the most recent Mortgage that was taken out on this home.
Original Mortgage
$413,054
Interest Rate
5.5%
Mortgage Type
FHA
Purchase Details
Closed on
Apr 10, 2018
Sold by
Lennar Homes Of California Inc
Bought by
Uribe Andrew and Corona Jesus A
Home Financials for this Owner
Home Financials are based on the most recent Mortgage that was taken out on this home.
Original Mortgage
$413,054
Interest Rate
5.5%
Mortgage Type
FHA
Create a Home Valuation Report for This Property
The Home Valuation Report is an in-depth analysis detailing your home's value as well as a comparison with similar homes in the area
Home Values in the Area
Average Home Value in this Area
Purchase History
| Date | Buyer | Sale Price | Title Company |
|---|---|---|---|
| Corona Isaura L | -- | Orange Coast Title Company | |
| Uribe Andrew | -- | North American Title Company | |
| Corona Jesus A | -- | North American Title Company | |
| Uribe Andrew | $449,000 | North American Title Company |
Source: Public Records
Mortgage History
| Date | Status | Borrower | Loan Amount |
|---|---|---|---|
| Open | Corona Isaura L | $431,420 | |
| Closed | Uribe Andrew | $413,054 |
Source: Public Records
Tax History Compared to Growth
Tax History
| Year | Tax Paid | Tax Assessment Tax Assessment Total Assessment is a certain percentage of the fair market value that is determined by local assessors to be the total taxable value of land and additions on the property. | Land | Improvement |
|---|---|---|---|---|
| 2025 | $9,092 | $506,963 | $172,938 | $334,025 |
| 2024 | $9,092 | $497,022 | $169,547 | $327,475 |
| 2023 | $8,474 | $487,277 | $166,223 | $321,054 |
| 2022 | $8,435 | $477,723 | $162,964 | $314,759 |
| 2021 | $8,363 | $468,356 | $159,769 | $308,587 |
| 2020 | $8,462 | $463,554 | $158,131 | $305,423 |
| 2019 | $8,271 | $457,948 | $158,100 | $299,848 |
| 2018 | $4,607 | $106,628 | $106,628 | $0 |
| 2017 | $1,729 | $104,537 | $104,537 | $0 |
| 2016 | -- | $0 | $0 | $0 |
Source: Public Records
Map
Nearby Homes
- 16960 Beachwood Ln
- 16843 Miller Ave
- 7702 Newport Ct
- 16733 Miller Ave
- 7470 Blanchard Ave
- 16737 Kalmia Ln
- 7760 Blanchard Ave
- 17279 Miller Ave
- 7625 Cypress Ave
- 7738 Encinitas Ave
- 17196 Barbee St
- 16827 Dove Tree Ln
- 7159 Kempster Ave
- 16554 Reed St
- 7938 Chantry Ave
- 0 Sierra Ave Unit EV22072866
- 17072 Fern St
- 17222 Fern St
- 17392 Paine St
- 7372 Oleander Ave
- 16932 Backwater Ln
- 16912 Backwater Ln
- 16923 Bayou Ln
- 16940 Backwater Ln
- 16939 Bayou Ln
- 16933 Backwater Ln
- 7574 Avocado Cove Dr
- 16941 Backwater Ln
- 7566 Avocado Cove Dr
- 7558 Avocado Cove Dr
- 7555 Sierra Ave
- 7576 Sleepy Creek Ave
- 16949 Backwater Ln
- 7584 Sleepy Creek Ave
- 7568 Sleepy Creek Ave
- 7560 Sleepy Creek Ave
- 16957 Backwater Ln
- 7552 Sleepy Creek Ave
- 7540 Avocado Cove Dr
- 16965 Backwater Ln