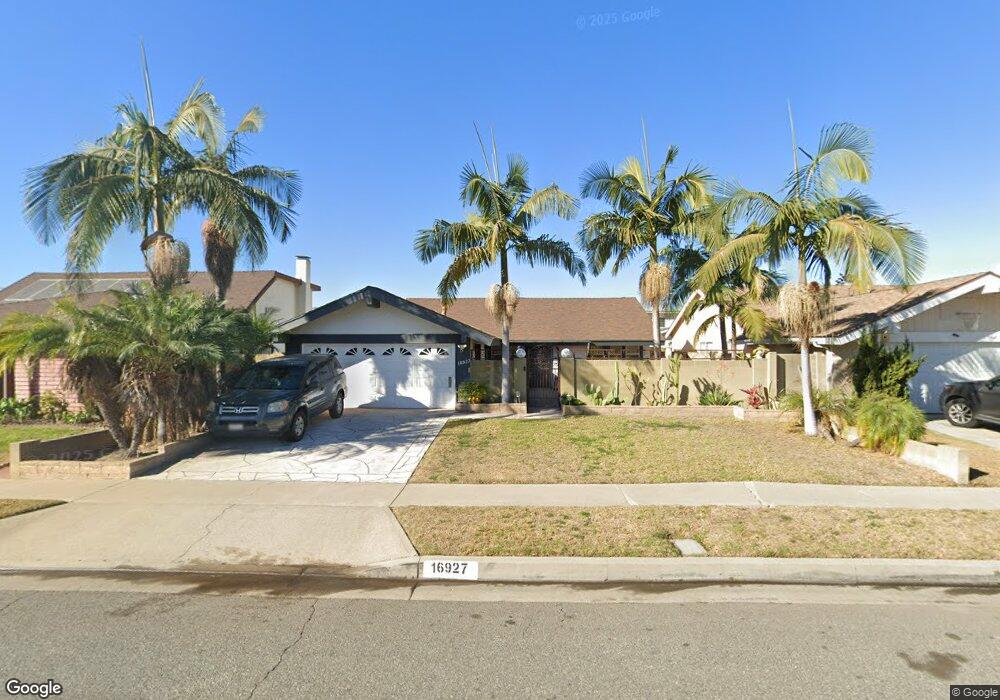
16927 Maurice Ave Cerritos, CA 90703
Estimated Value: $946,000 - $1,177,000
3
Beds
2
Baths
1,104
Sq Ft
$945/Sq Ft
Est. Value
About This Home
This home is located at 16927 Maurice Ave, Cerritos, CA 90703 and is currently estimated at $1,043,547, approximately $945 per square foot. 16927 Maurice Ave is a home located in Los Angeles County with nearby schools including Wittmann (Helen) Elementary School, Carmenita Middle School, and Gahr High School.
Ownership History
Date
Name
Owned For
Owner Type
Purchase Details
Closed on
May 20, 2004
Sold by
Chen Lawrence
Bought by
Chan Minton P H and Chan Jackie Y C
Current Estimated Value
Home Financials for this Owner
Home Financials are based on the most recent Mortgage that was taken out on this home.
Original Mortgage
$200,000
Outstanding Balance
$90,462
Interest Rate
5%
Mortgage Type
Purchase Money Mortgage
Estimated Equity
$953,085
Purchase Details
Closed on
Jun 1, 1999
Sold by
Johnson Elsy F
Bought by
Chen Lawrence
Home Financials for this Owner
Home Financials are based on the most recent Mortgage that was taken out on this home.
Original Mortgage
$163,450
Interest Rate
6.87%
Purchase Details
Closed on
Apr 20, 1994
Sold by
Johnson Elsy Ferrer
Bought by
Johnson Elsy Ferrer
Home Financials for this Owner
Home Financials are based on the most recent Mortgage that was taken out on this home.
Original Mortgage
$70,000
Interest Rate
7.67%
Create a Home Valuation Report for This Property
The Home Valuation Report is an in-depth analysis detailing your home's value as well as a comparison with similar homes in the area
Home Values in the Area
Average Home Value in this Area
Purchase History
| Date | Buyer | Sale Price | Title Company |
|---|---|---|---|
| Chan Minton P H | $512,500 | Ticor Title Company | |
| Chen Lawrence | $233,500 | North American Title Co | |
| Johnson Elsy Ferrer | -- | Equity Title |
Source: Public Records
Mortgage History
| Date | Status | Borrower | Loan Amount |
|---|---|---|---|
| Open | Chan Minton P H | $200,000 | |
| Previous Owner | Chen Lawrence | $163,450 | |
| Previous Owner | Johnson Elsy Ferrer | $70,000 | |
| Closed | Chan Minton P H | $130,000 |
Source: Public Records
Tax History Compared to Growth
Tax History
| Year | Tax Paid | Tax Assessment Tax Assessment Total Assessment is a certain percentage of the fair market value that is determined by local assessors to be the total taxable value of land and additions on the property. | Land | Improvement |
|---|---|---|---|---|
| 2025 | $4,749 | $389,086 | $97,474 | $291,612 |
| 2024 | $4,749 | $381,458 | $95,563 | $285,895 |
| 2023 | $4,596 | $373,980 | $93,690 | $280,290 |
| 2022 | $4,523 | $366,648 | $91,853 | $274,795 |
| 2021 | $4,416 | $359,459 | $90,052 | $269,407 |
| 2019 | $4,313 | $348,799 | $87,382 | $261,417 |
| 2018 | $3,981 | $341,961 | $85,669 | $256,292 |
| 2016 | $3,817 | $328,685 | $82,344 | $246,341 |
| 2015 | $3,766 | $323,749 | $81,108 | $242,641 |
| 2014 | $3,693 | $317,408 | $79,520 | $237,888 |
Source: Public Records
Map
Nearby Homes
- 13010 Artesia Blvd
- 13370 Holly Oak Cir
- 16611 Shenandoah Ave
- 16429 Westbrook Ln
- 16308 Indian Creek Rd
- 12567 Semora St
- 18006 Point Conception Place
- 12525 Semora St
- 12512 Sandycreek Ln
- 13210 Sutton St
- 17103 Cortner Ave
- 16329 Cherry Fall Ln
- 13044 Hedda Ln
- 13548 Village Dr Unit A
- 16118 Rockyriver Ln
- 12356 Reva St
- 12161 Napoli Dr
- 0 Parcel: 7016-014-017 Ave Unit PW25183248
- 16011 Sugarpine Ln
- 15312 Roper Ave
- 16921 Maurice Ave
- 16931 Maurice Ave
- 16926 Jeanette Ave
- 17003 Maurice Ave
- 16930 Jeanette Ave
- 16920 Jeanette Ave
- 17002 Jeanette Ave
- 16926 Maurice Ave
- 17009 Maurice Ave
- 16920 Maurice Ave
- 16930 Maurice Ave
- 17002 Maurice Ave
- 17008 Jeanette Ave
- 12939 Lucas Ln
- 12955 Lucas Ln
- 17015 Maurice Ave
- 12945 Lucas Ln
- 12927 Lucas Ln
- 17008 Maurice Ave
- 17014 Jeanette Ave