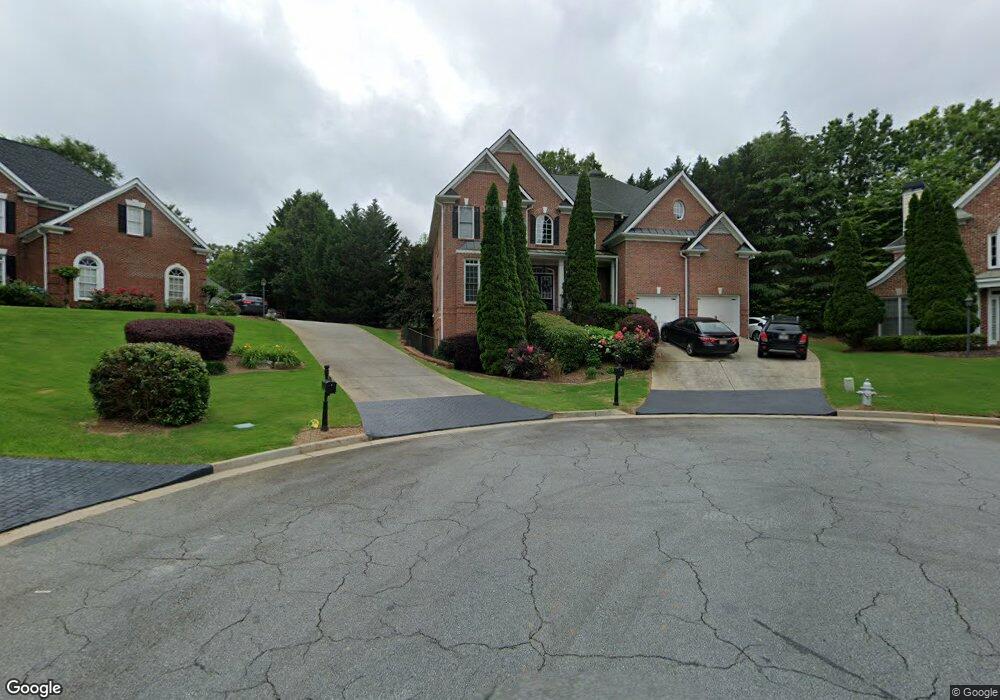
1693 Hampton Oaks Bend Marietta, GA 30066
Sandy Plains NeighborhoodEstimated Value: $717,000 - $1,110,000
5
Beds
5
Baths
3,864
Sq Ft
$220/Sq Ft
Est. Value
About This Home
This home is located at 1693 Hampton Oaks Bend, Marietta, GA 30066 and is currently estimated at $849,986, approximately $219 per square foot. 1693 Hampton Oaks Bend is a home located in Cobb County with nearby schools including Addison Elementary School, Simpson Middle School, and Sprayberry High School.
Ownership History
Date
Name
Owned For
Owner Type
Purchase Details
Closed on
Jul 5, 2013
Sold by
Behnia Asa
Bought by
Toosi Mehrad S
Current Estimated Value
Home Financials for this Owner
Home Financials are based on the most recent Mortgage that was taken out on this home.
Original Mortgage
$383,400
Outstanding Balance
$277,768
Interest Rate
3.91%
Mortgage Type
New Conventional
Estimated Equity
$572,218
Purchase Details
Closed on
Feb 23, 2007
Sold by
Wade Scott T and Wade Kristin R
Bought by
Behnia Asa
Home Financials for this Owner
Home Financials are based on the most recent Mortgage that was taken out on this home.
Original Mortgage
$92,880
Interest Rate
6.19%
Mortgage Type
New Conventional
Purchase Details
Closed on
Jan 9, 2004
Sold by
Robert Harris Homes Inc
Bought by
Wade Scott T and Wade Kristin
Home Financials for this Owner
Home Financials are based on the most recent Mortgage that was taken out on this home.
Original Mortgage
$366,000
Interest Rate
5.85%
Create a Home Valuation Report for This Property
The Home Valuation Report is an in-depth analysis detailing your home's value as well as a comparison with similar homes in the area
Home Values in the Area
Average Home Value in this Area
Purchase History
| Date | Buyer | Sale Price | Title Company |
|---|---|---|---|
| Toosi Mehrad S | $430,772 | -- | |
| Behnia Asa | $464,400 | -- | |
| Wade Scott T | -- | -- | |
| Wade Scott T | $426,900 | -- |
Source: Public Records
Mortgage History
| Date | Status | Borrower | Loan Amount |
|---|---|---|---|
| Open | Toosi Mehrad S | $383,400 | |
| Previous Owner | Wade Scott T | $92,880 | |
| Previous Owner | Wade Scott T | $371,520 | |
| Previous Owner | Wade Scott T | $366,000 |
Source: Public Records
Tax History Compared to Growth
Tax History
| Year | Tax Paid | Tax Assessment Tax Assessment Total Assessment is a certain percentage of the fair market value that is determined by local assessors to be the total taxable value of land and additions on the property. | Land | Improvement |
|---|---|---|---|---|
| 2025 | $8,250 | $273,812 | $60,800 | $213,012 |
| 2024 | $8,255 | $273,812 | $60,800 | $213,012 |
| 2023 | $7,509 | $249,064 | $42,500 | $206,564 |
| 2022 | $6,357 | $209,456 | $37,400 | $172,056 |
| 2021 | $5,725 | $188,644 | $37,400 | $151,244 |
| 2020 | $5,725 | $188,644 | $37,400 | $151,244 |
| 2019 | $5,251 | $173,016 | $30,000 | $143,016 |
| 2018 | $5,251 | $173,016 | $30,000 | $143,016 |
| 2017 | $4,974 | $173,016 | $30,000 | $143,016 |
| 2016 | $4,974 | $173,016 | $30,000 | $143,016 |
| 2015 | $4,129 | $140,144 | $30,000 | $110,144 |
| 2014 | $4,164 | $140,144 | $0 | $0 |
Source: Public Records
Map
Nearby Homes
- 1445 Woodhill Dr
- 3399 Clair Cir
- 3391 Fawn Trail
- 3703 Tulip Tree Rd
- 3328 Knight Rd
- 3492 Ember St
- 1833 Lake Ebenezer Trail NE
- 3796 Hickory Ridge Ct
- 1810 Ebenezer Farm Cir
- 1234 Windburn Dr
- 3886 Ebenezer Rd
- 1130 Blackwell Rd
- 3316 Renfro St
- 1076 Blackwell Rd
- 3287 Allegheny Dr
- 3634 Stonehenge Way NE
- 3980 Philmont Dr
- 1192 Pathfinder Rd
- 1186 Lincoln Dr
- 2011 Shadowwood Dr
- 0 Canfield Ln Unit 7475438
- 0 Canfield Ln Unit 8996533
- 0 Canfield Ln
- 1694 Hampton Oaks Bend
- 1601 Hampton Oaks Bend
- 1605 Hampton Oaks Bend
- 3461 Ebenezer Rd
- 1690 Hampton Oaks Bend
- 1529 Canfield Ln Unit 4
- 1529 Canfield Ln
- 1529 Canfield Unit 4
- 1529 Canfield
- 1529 Canfield Ln
- 1529 Canfield Ln Unit 4
- 1521 Canfield Ln
- 1609 Hampton Oaks Bend
- 1685 Hampton Oaks Bend
- 1686 Hampton Oaks Bend
- 1532 Canfield Ln