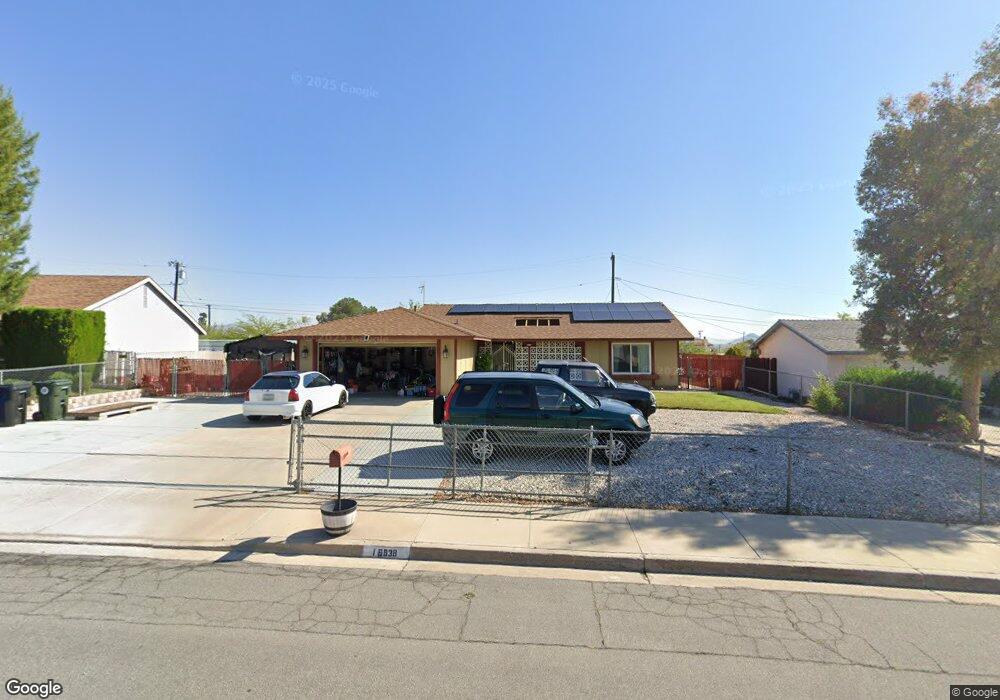
16938 Molino Dr Victorville, CA 92395
Estimated Value: $385,113 - $407,000
3
Beds
2
Baths
1,494
Sq Ft
$264/Sq Ft
Est. Value
About This Home
This home is located at 16938 Molino Dr, Victorville, CA 92395 and is currently estimated at $395,028, approximately $264 per square foot. 16938 Molino Dr is a home located in San Bernardino County with nearby schools including Green Tree East Elementary School, Del Rey Elementary School, and Lakeview Leadership Academy.
Ownership History
Date
Name
Owned For
Owner Type
Purchase Details
Closed on
Mar 18, 2016
Sold by
Quintero Jose Jesus Gonzalez
Bought by
Haindinyak Jessica H L and Haidinyak Jason E
Current Estimated Value
Home Financials for this Owner
Home Financials are based on the most recent Mortgage that was taken out on this home.
Original Mortgage
$177,721
Outstanding Balance
$141,038
Interest Rate
3.73%
Mortgage Type
FHA
Estimated Equity
$253,990
Purchase Details
Closed on
Mar 4, 2011
Sold by
Chiu Suk Ha Linda
Bought by
Quintero Jose Jesus Gonzalez and Rivera Lisette V
Home Financials for this Owner
Home Financials are based on the most recent Mortgage that was taken out on this home.
Original Mortgage
$95,000
Interest Rate
4.9%
Mortgage Type
VA
Purchase Details
Closed on
Nov 27, 1996
Sold by
Chiu Suk Ha L
Bought by
Chiu Suk Ha Linda and Suk Ha Linda Chiu Revocable Tr
Create a Home Valuation Report for This Property
The Home Valuation Report is an in-depth analysis detailing your home's value as well as a comparison with similar homes in the area
Home Values in the Area
Average Home Value in this Area
Purchase History
| Date | Buyer | Sale Price | Title Company |
|---|---|---|---|
| Haindinyak Jessica H L | $181,000 | First American Title Company | |
| Quintero Jose Jesus Gonzalez | $95,000 | Fidelity National Title | |
| Chiu Suk Ha Linda | -- | -- |
Source: Public Records
Mortgage History
| Date | Status | Borrower | Loan Amount |
|---|---|---|---|
| Open | Haindinyak Jessica H L | $177,721 | |
| Previous Owner | Quintero Jose Jesus Gonzalez | $95,000 |
Source: Public Records
Tax History Compared to Growth
Tax History
| Year | Tax Paid | Tax Assessment Tax Assessment Total Assessment is a certain percentage of the fair market value that is determined by local assessors to be the total taxable value of land and additions on the property. | Land | Improvement |
|---|---|---|---|---|
| 2025 | $2,448 | $214,267 | $42,853 | $171,414 |
| 2024 | $2,448 | $210,066 | $42,013 | $168,053 |
| 2023 | $2,422 | $205,947 | $41,189 | $164,758 |
| 2022 | $2,379 | $201,908 | $40,381 | $161,527 |
| 2021 | $2,335 | $197,949 | $39,589 | $158,360 |
| 2020 | $2,292 | $195,919 | $39,183 | $156,736 |
| 2019 | $2,253 | $192,078 | $38,415 | $153,663 |
| 2018 | $2,398 | $188,312 | $37,662 | $150,650 |
| 2017 | $2,347 | $184,620 | $36,924 | $147,696 |
| 2016 | $1,280 | $102,816 | $25,704 | $77,112 |
| 2015 | $1,234 | $101,272 | $25,318 | $75,954 |
| 2014 | $1,209 | $99,288 | $24,822 | $74,466 |
Source: Public Records
Map
Nearby Homes
- 16924 Crestview Dr
- 14312 Hesperia Rd
- 14318 Montecito Dr
- 0 Brentwood Dr Unit IG25116389
- 0 W Spring Valley Pkwy Unit HD22096143
- 0 Avalon St Unit HD22082844
- 14385 Cactus Dr
- 14375 Cactus Dr
- 0 Montecito Dr Unit IV25019875
- 14055 Montecito Dr
- 5 Apple Creek Dr
- 18340 Niagra
- 0 Avalon Ave & A St & Allen 3rd Forrest Unit NP25194080
- 13145 Autumn Leaves Ave
- 0 NW St Unit HD25231155
- 5 Lot 5 E St
- 0 A Street & 3rd St (Nr Avalon Av) Unit NP25194343
- 16779 Pebble Beach
- 16582 Batson Rd
- 0 City View Dr Unit HD25142391
- 16952 Molino Dr
- 16924 Molino Dr
- 16969 Lorene Dr
- 16989 Lorene Dr
- 16949 Lorene Dr
- 16966 Molino Dr
- 16910 Molino Dr
- 16921 Molino Dr
- 16911 Molino Dr
- 16929 Lorene Dr
- 16999 Lorene Dr
- 16491 Molino Dr
- 16909 Lorene Dr
- 16980 Molino Dr
- 17001 Lorene Dr
- 14401 Woodland Dr
- 16961 Molino Dr
- 16990 Lorene Dr
- 14357 Woodland Dr
- 14442 Woodland Dr