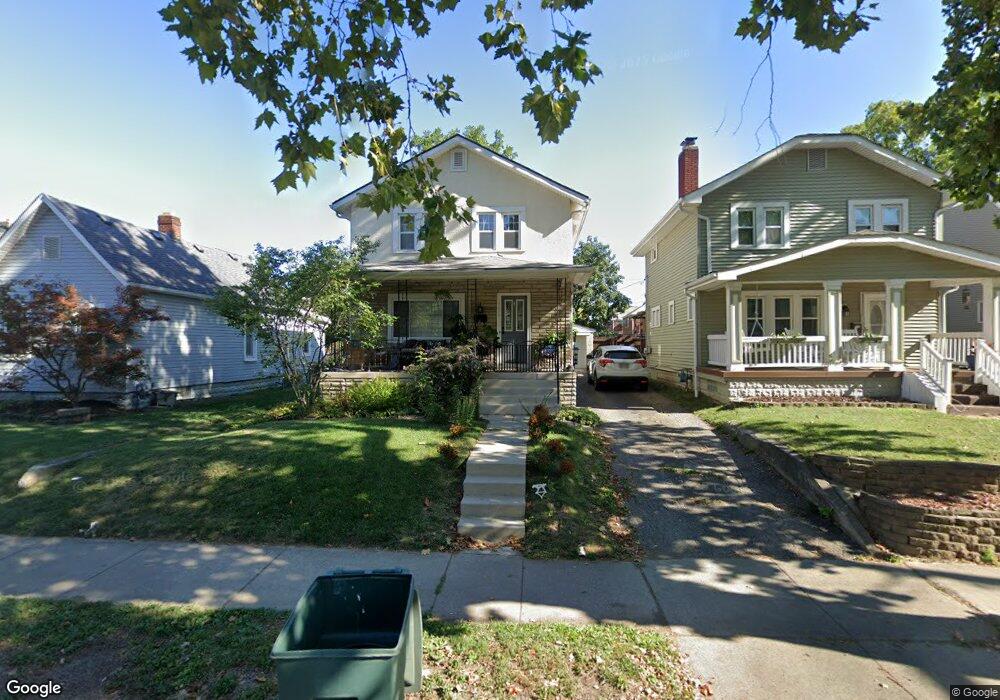
1694 W 3rd Ave Columbus, OH 43212
Fifth by Northwest NeighborhoodEstimated Value: $418,000 - $497,000
3
Beds
2
Baths
1,126
Sq Ft
$391/Sq Ft
Est. Value
About This Home
This home is located at 1694 W 3rd Ave, Columbus, OH 43212 and is currently estimated at $440,523, approximately $391 per square foot. 1694 W 3rd Ave is a home located in Franklin County with nearby schools including Cranbrook Elementary School, Ridgeview Middle School, and Centennial High School.
Ownership History
Date
Name
Owned For
Owner Type
Purchase Details
Closed on
Jun 23, 2017
Sold by
Tweddle Andrew Todd
Bought by
Dec Ohio Llc
Current Estimated Value
Home Financials for this Owner
Home Financials are based on the most recent Mortgage that was taken out on this home.
Original Mortgage
$248,000
Outstanding Balance
$169,122
Interest Rate
4.05%
Mortgage Type
Commercial
Estimated Equity
$271,401
Purchase Details
Closed on
Dec 28, 2011
Sold by
Verbance Sharon L
Bought by
Tweddle Andrew Todd
Home Financials for this Owner
Home Financials are based on the most recent Mortgage that was taken out on this home.
Original Mortgage
$182,400
Interest Rate
3.99%
Mortgage Type
New Conventional
Purchase Details
Closed on
Jun 3, 2011
Sold by
Rossi Yola M
Bought by
Verbance Sharon L
Purchase Details
Closed on
May 12, 1969
Bought by
Rossi Yola M
Create a Home Valuation Report for This Property
The Home Valuation Report is an in-depth analysis detailing your home's value as well as a comparison with similar homes in the area
Home Values in the Area
Average Home Value in this Area
Purchase History
| Date | Buyer | Sale Price | Title Company |
|---|---|---|---|
| Dec Ohio Llc | $310,000 | None Available | |
| Tweddle Andrew Todd | $228,000 | Powell Tit | |
| Verbance Sharon L | $150,000 | Powell Tit | |
| Rossi Yola M | -- | -- |
Source: Public Records
Mortgage History
| Date | Status | Borrower | Loan Amount |
|---|---|---|---|
| Open | Dec Ohio Llc | $248,000 | |
| Previous Owner | Tweddle Andrew Todd | $182,400 |
Source: Public Records
Tax History Compared to Growth
Tax History
| Year | Tax Paid | Tax Assessment Tax Assessment Total Assessment is a certain percentage of the fair market value that is determined by local assessors to be the total taxable value of land and additions on the property. | Land | Improvement |
|---|---|---|---|---|
| 2024 | $5,448 | $115,610 | $41,480 | $74,130 |
| 2023 | $5,382 | $115,610 | $41,480 | $74,130 |
| 2022 | $5,673 | $103,920 | $18,690 | $85,230 |
| 2021 | $5,682 | $103,920 | $18,690 | $85,230 |
| 2020 | $5,541 | $103,920 | $18,690 | $85,230 |
| 2019 | $4,975 | $80,010 | $18,690 | $61,320 |
| 2018 | $4,325 | $80,010 | $18,690 | $61,320 |
| 2017 | $4,176 | $70,840 | $18,690 | $52,150 |
| 2016 | $4,058 | $61,260 | $17,680 | $43,580 |
| 2015 | $3,684 | $61,260 | $17,680 | $43,580 |
| 2014 | $3,693 | $61,260 | $17,680 | $43,580 |
| 2013 | $1,735 | $58,345 | $16,835 | $41,510 |
Source: Public Records
Map
Nearby Homes
- 1459 Elmwood Ave Unit 1459
- 1263 Oakland Ave
- 1561 Glenn Ave
- 1475 W 3rd Ave Unit 204
- 1313 Lincoln Rd
- 1655-1657 Ashland Ave
- 1661 Ashland Ave Unit 663
- 1733 Elmwood Ave
- 1364 W 7th Ave
- 1782 Wyandotte Rd
- 1000 Urlin Ave Unit 1822
- 1000 Urlin Ave Unit 2007
- 1000 Urlin Ave Unit 520
- 1000 Urlin Ave Unit 605
- 1000 Urlin Ave Unit 511
- 1000 Urlin Ave Unit 1007
- 1000 Urlin Ave Unit 518
- 1000 Urlin Ave Unit 1607
- 2015 W 5th Ave Unit 211
- 2015 W 5th Ave Unit 102
- 1688 W 3rd Ave
- 1696 W 3rd Ave
- 1405 Ashland Ave
- 1704-1706-1706 W 3rd Ave Unit 1706
- 1704 W 3rd Ave Unit 706
- 1676 W 3rd Ave Unit 678
- 1413 Ashland Ave
- 1712 W 3rd Ave
- 1695 W 3rd Ave
- 1689 W 3rd Ave
- 1423 Ashland Ave
- 1683 W 3rd Ave
- 1703 W 3rd Ave
- 1677 W 3rd Ave
- 1658 W 3rd Ave
- 1669 W 3rd Ave
- 0 Ashland Ave
- 1429 Ashland Ave
- 1721 W 3rd Ave
- 1440 Elmwood Ave Unit C