Estimated Value: $635,047 - $928,000
4
Beds
3
Baths
1,842
Sq Ft
$397/Sq Ft
Est. Value
About This Home
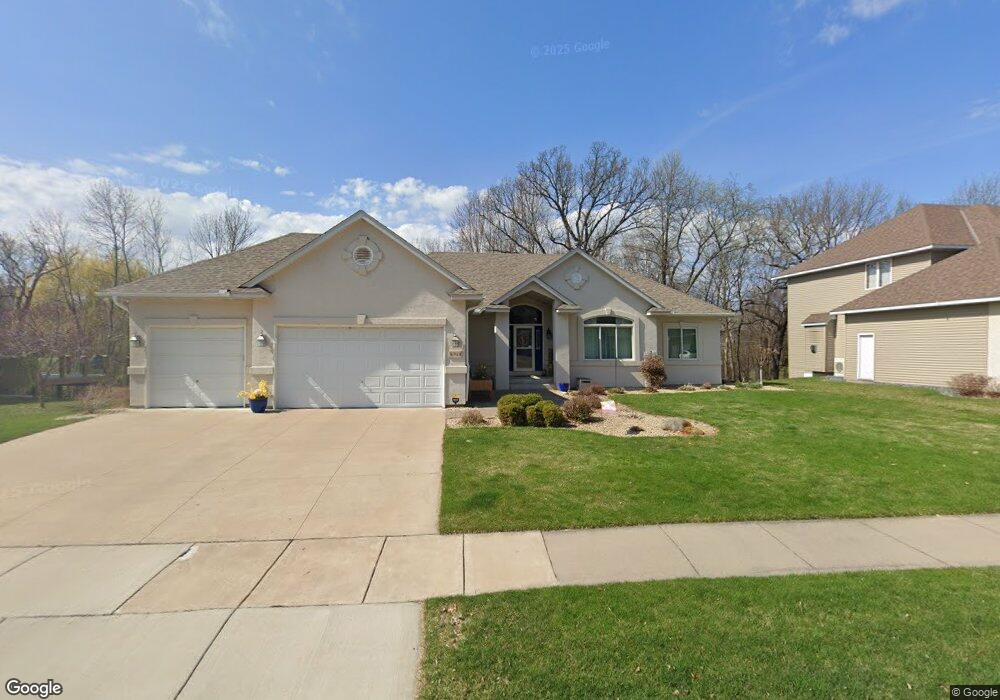
This home is located at 16944 80th Place N, Osseo, MN 55311 and is currently estimated at $730,512, approximately $396 per square foot. 16944 80th Place N is a home located in Hennepin County with nearby schools including Rush Creek Elementary School, Maple Grove Middle School, and Maple Grove Senior High School.
Ownership History
Date
Name
Owned For
Owner Type
Purchase Details
Closed on
Jul 17, 2018
Sold by
Kastendieck Steven D and Kastendieck Teresa J
Bought by
Kastendieck Steven D and Kastendieck Teresa J
Current Estimated Value
Purchase Details
Closed on
Sep 20, 2011
Sold by
Ehmke D Keith and Ehmke Margaret K
Bought by
Kastendieck Steven D
Home Financials for this Owner
Home Financials are based on the most recent Mortgage that was taken out on this home.
Original Mortgage
$299,850
Interest Rate
4.12%
Mortgage Type
New Conventional
Purchase Details
Closed on
Jun 11, 1999
Sold by
Young Patrick J
Bought by
Ehmke D Keith and Ehmke Margaret K
Purchase Details
Closed on
Jun 9, 1997
Sold by
Damon Homes Inc
Bought by
Young Patrick J
Purchase Details
Closed on
Nov 6, 1996
Sold by
Windsor Development Llp
Bought by
Damon Homes Inc
Create a Home Valuation Report for This Property
The Home Valuation Report is an in-depth analysis detailing your home's value as well as a comparison with similar homes in the area
Home Values in the Area
Average Home Value in this Area
Purchase History
| Date | Buyer | Sale Price | Title Company |
|---|---|---|---|
| Kastendieck Steven D | -- | None Available | |
| Kastendieck Steven D | $399,800 | Burnet Title | |
| Ehmke D Keith | $318,900 | -- | |
| Young Patrick J | $213,000 | -- | |
| Damon Homes Inc | $68,900 | -- |
Source: Public Records
Mortgage History
| Date | Status | Borrower | Loan Amount |
|---|---|---|---|
| Previous Owner | Kastendieck Steven D | $299,850 |
Source: Public Records
Tax History Compared to Growth
Tax History
| Year | Tax Paid | Tax Assessment Tax Assessment Total Assessment is a certain percentage of the fair market value that is determined by local assessors to be the total taxable value of land and additions on the property. | Land | Improvement |
|---|---|---|---|---|
| 2024 | $7,509 | $597,800 | $126,900 | $470,900 |
| 2023 | $7,053 | $584,700 | $138,000 | $446,700 |
| 2022 | $6,137 | $582,800 | $114,200 | $468,600 |
| 2021 | $5,516 | $504,700 | $96,000 | $408,700 |
| 2020 | $5,792 | $446,900 | $57,900 | $389,000 |
| 2019 | $6,656 | $445,600 | $86,100 | $359,500 |
| 2018 | $6,269 | $483,300 | $99,100 | $384,200 |
| 2017 | $5,949 | $406,700 | $99,000 | $307,700 |
| 2016 | $5,922 | $399,700 | $99,000 | $300,700 |
| 2015 | $5,833 | $384,100 | $102,000 | $282,100 |
| 2014 | -- | $390,100 | $112,000 | $278,100 |
Source: Public Records
Map
Nearby Homes
- 16878 79th Place N
- 16824 79th Ave N
- 16997 78th Place N
- 7788 Everest Ct N
- 7200 Comstock Ln N
- 17005 78th Ct N
- 7722 Everest Ln N
- 8347 Zanzibar Ct N
- 8048 Narcissus Ln N
- 7585 Blackoaks Ln N
- 7547 Inland Ln N
- 16955 Weaver Lake Dr
- 7461 Merrimac Ln N
- 16917 73rd Place N
- 7731 Queensland Ln N
- 8713 Blackoaks Ln N
- 7870 Ranchview Ln N
- 16586 73rd Ave N
- 7225 Everest Ln N
- 8883 Fountain Ln N
- 16922 80th Place N
- 16966 80th Place N
- 16890 80th Place N
- 8060 Everest Ln N
- 6396 Archer Ln N
- 8078 Everest Ln N
- 16957 80th Place N
- 16935 80th Place N
- 16878 80th Place N
- 8086 Everest Ln N
- 16969 80th Place N
- 16913 80th Place N
- 16881 80th Place N
- 8104 Everest Ln N
- 16981 80th Place N
- 16856 80th Place N
- 17051 80th Place N
- 16869 80th Place N
- 8122 Everest Ln N
- 16866 79th Place N