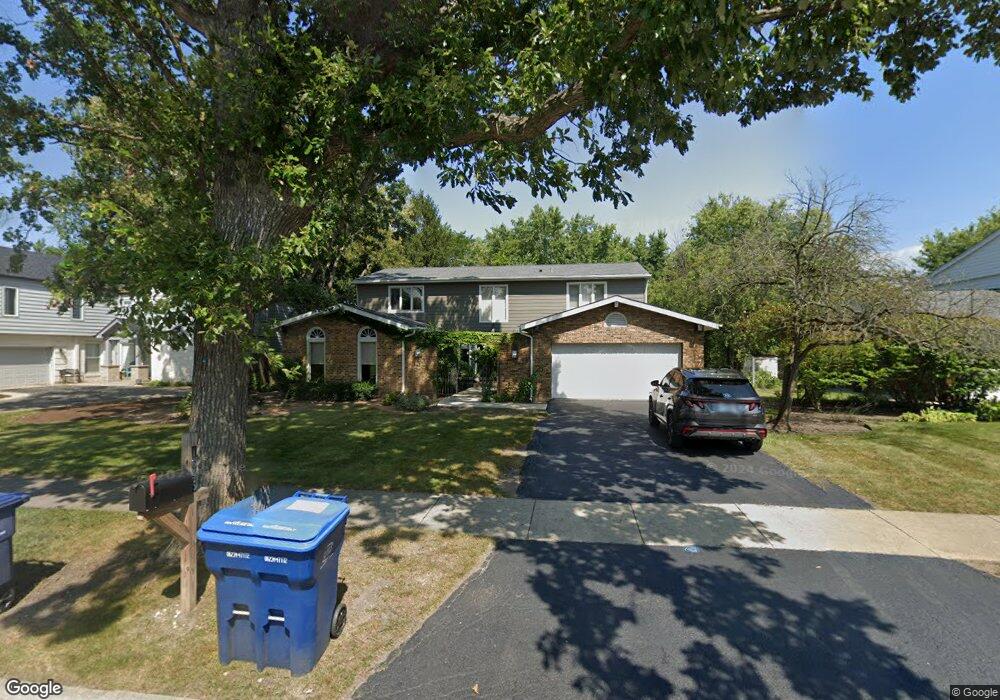
1695 Overland Trail Deerfield, IL 60015
Estimated Value: $876,000 - $975,000
4
Beds
3
Baths
3,119
Sq Ft
$292/Sq Ft
Est. Value
About This Home
This home is located at 1695 Overland Trail, Deerfield, IL 60015 and is currently estimated at $910,324, approximately $291 per square foot. 1695 Overland Trail is a home located in Lake County with nearby schools including Walden Elementary School, Alan B Shepard Middle School, and Deerfield High School.
Ownership History
Date
Name
Owned For
Owner Type
Purchase Details
Closed on
Aug 3, 2004
Sold by
Dlugie Perry and Gerber Tracee
Bought by
Lanin Howard and Lanin Allison
Current Estimated Value
Home Financials for this Owner
Home Financials are based on the most recent Mortgage that was taken out on this home.
Original Mortgage
$625,000
Interest Rate
6.1%
Mortgage Type
Unknown
Purchase Details
Closed on
Feb 19, 2004
Sold by
Lason Shirley
Bought by
Dlugie Perry and Gerber Tracee
Home Financials for this Owner
Home Financials are based on the most recent Mortgage that was taken out on this home.
Original Mortgage
$333,700
Interest Rate
5.71%
Mortgage Type
Unknown
Purchase Details
Closed on
Dec 12, 1994
Sold by
Lason Louis J and Lason Shirley S
Bought by
Shirley Lason Trust
Create a Home Valuation Report for This Property
The Home Valuation Report is an in-depth analysis detailing your home's value as well as a comparison with similar homes in the area
Home Values in the Area
Average Home Value in this Area
Purchase History
| Date | Buyer | Sale Price | Title Company |
|---|---|---|---|
| Lanin Howard | $655,000 | Premier Title | |
| Dlugie Perry | $565,000 | Chicago Title Insurance Co | |
| Shirley Lason Trust | -- | -- |
Source: Public Records
Mortgage History
| Date | Status | Borrower | Loan Amount |
|---|---|---|---|
| Closed | Lanin Howard | $625,000 | |
| Previous Owner | Dlugie Perry | $333,700 | |
| Closed | Dlugie Perry | $118,300 |
Source: Public Records
Tax History Compared to Growth
Tax History
| Year | Tax Paid | Tax Assessment Tax Assessment Total Assessment is a certain percentage of the fair market value that is determined by local assessors to be the total taxable value of land and additions on the property. | Land | Improvement |
|---|---|---|---|---|
| 2024 | $19,230 | $221,307 | $55,794 | $165,513 |
| 2023 | $19,125 | $212,387 | $53,545 | $158,842 |
| 2022 | $19,125 | $207,913 | $59,811 | $148,102 |
| 2021 | $19,403 | $215,092 | $57,666 | $157,426 |
| 2020 | $18,660 | $215,544 | $57,787 | $157,757 |
| 2019 | $17,366 | $205,195 | $57,689 | $147,506 |
| 2018 | $16,551 | $203,797 | $61,145 | $142,652 |
| 2017 | $16,421 | $203,147 | $60,950 | $142,197 |
| 2016 | $15,971 | $195,465 | $58,645 | $136,820 |
| 2015 | $15,649 | $183,656 | $55,102 | $128,554 |
| 2014 | $16,521 | $190,863 | $55,497 | $135,366 |
| 2012 | $16,114 | $189,179 | $55,007 | $134,172 |
Source: Public Records
Map
Nearby Homes
- 1770 Overland Trail
- 1444 Crowe Ave
- 1504 Northwoods Rd
- 1265 Woodland Dr
- 1342 Barclay Ln Unit 36
- 1131 Linden Ave
- 1410 Berkley Ct
- 1423 Northwoods Rd
- 1670 Meadow Ln
- 1380 Valley Rd
- 1045 Fairoaks Ave
- 602 Warwick Rd
- 1620 Berkeley Ct
- 1041 Sheridan Ave
- 2005 Keats Ln
- 2372 Tennyson Ln
- 1953 Keats Ct
- 1119 Hampton Ct Unit 1
- 1341 Carlisle Place
- 904 Forest Ave
- 1705 Overland Trail
- 1685 Overland Trail
- 1712 Mountain Dr
- 1665 Overland Trail
- 1715 Overland Trail
- 1720 Mountain Dr
- 1700 Mountain Dr
- 1728 Mountain Dr
- 1690 Overland Trail
- 1700 Overland Trail
- 1040 Mountain Dr
- 1655 Overland Trail
- 1680 Overland Trail
- 1725 Overland Trail
- 1710 Overland Trail
- 1660 Overland Trail
- 1720 Overland Trail
- 1035 Mountain Dr
- 1065 Summit Dr
- 1645 Overland Trail