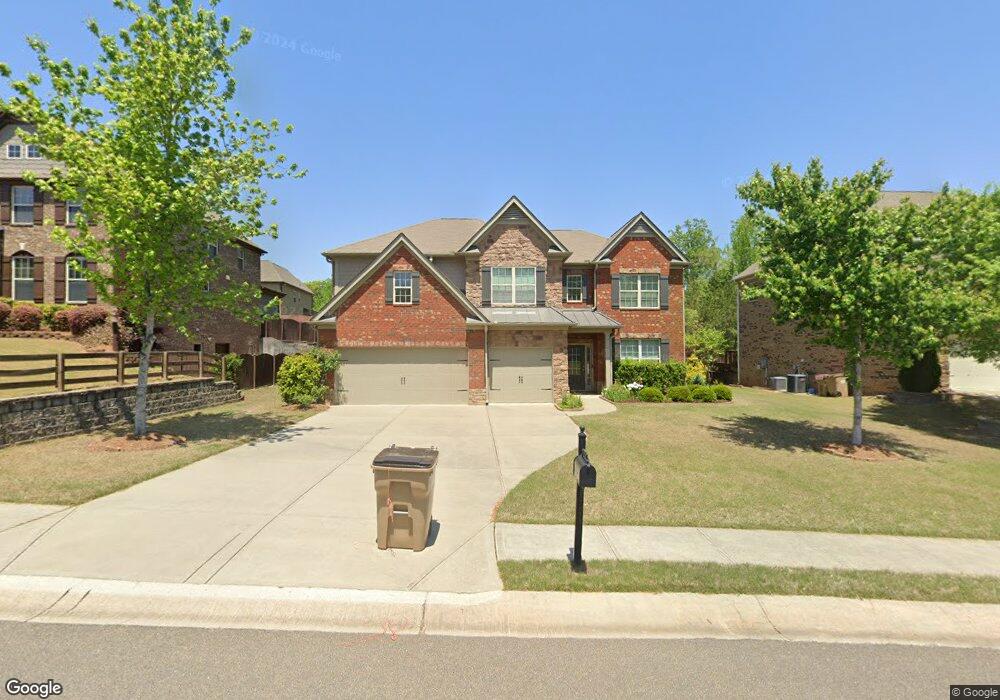
1695 Thunder Gulch Pass Suwanee, GA 30024
Estimated Value: $762,609 - $907,000
5
Beds
4
Baths
4,248
Sq Ft
$192/Sq Ft
Est. Value
About This Home
This home is located at 1695 Thunder Gulch Pass, Suwanee, GA 30024 and is currently estimated at $816,652, approximately $192 per square foot. 1695 Thunder Gulch Pass is a home located in Forsyth County with nearby schools including Settles Bridge Elementary School, Riverwatch Middle School, and Lambert High School.
Ownership History
Date
Name
Owned For
Owner Type
Purchase Details
Closed on
Jan 30, 2013
Sold by
Dr Horton Inc
Bought by
Luo Danlin and Yin Xinhua
Current Estimated Value
Home Financials for this Owner
Home Financials are based on the most recent Mortgage that was taken out on this home.
Original Mortgage
$247,245
Outstanding Balance
$172,358
Interest Rate
3.35%
Mortgage Type
New Conventional
Estimated Equity
$644,294
Purchase Details
Closed on
Jul 5, 2012
Sold by
Fdic
Bought by
Dr Horton Inc
Purchase Details
Closed on
Oct 6, 2009
Sold by
Ccd Homes Llc
Bought by
Integrity Bk
Purchase Details
Closed on
Oct 30, 2006
Sold by
James Burgess Road Llc
Bought by
Ccd Homes Llc
Home Financials for this Owner
Home Financials are based on the most recent Mortgage that was taken out on this home.
Original Mortgage
$1,330,000
Interest Rate
6.27%
Create a Home Valuation Report for This Property
The Home Valuation Report is an in-depth analysis detailing your home's value as well as a comparison with similar homes in the area
Home Values in the Area
Average Home Value in this Area
Purchase History
| Date | Buyer | Sale Price | Title Company |
|---|---|---|---|
| Luo Danlin | $309,057 | -- | |
| Dr Horton Inc | $540,000 | -- | |
| Integrity Bk | $612,000 | -- | |
| Ccd Homes Llc | $1,330,000 | -- |
Source: Public Records
Mortgage History
| Date | Status | Borrower | Loan Amount |
|---|---|---|---|
| Open | Luo Danlin | $247,245 | |
| Previous Owner | Ccd Homes Llc | $1,330,000 |
Source: Public Records
Tax History Compared to Growth
Tax History
| Year | Tax Paid | Tax Assessment Tax Assessment Total Assessment is a certain percentage of the fair market value that is determined by local assessors to be the total taxable value of land and additions on the property. | Land | Improvement |
|---|---|---|---|---|
| 2025 | $7,877 | $307,792 | $70,000 | $237,792 |
| 2024 | $7,877 | $321,216 | $70,000 | $251,216 |
| 2023 | $7,764 | $315,424 | $60,000 | $255,424 |
| 2022 | $6,560 | $182,864 | $32,000 | $150,864 |
| 2021 | $5,050 | $182,864 | $32,000 | $150,864 |
| 2020 | $5,134 | $185,928 | $32,000 | $153,928 |
| 2019 | $5,142 | $185,928 | $32,000 | $153,928 |
| 2018 | $4,416 | $185,928 | $32,000 | $153,928 |
| 2017 | $3,703 | $133,424 | $32,000 | $101,424 |
| 2016 | $3,481 | $125,424 | $24,000 | $101,424 |
| 2015 | $3,487 | $125,424 | $24,000 | $101,424 |
| 2014 | -- | $104,224 | $24,000 | $80,224 |
Source: Public Records
Map
Nearby Homes
- 812 Lakemere Crest
- 1445 Thunder Gulch Pass
- 1610 Apollo Dr
- 1140 Deborah Ln
- 338 Grand Ave
- 109 Highgrove Dr
- 1750 Cone Flower Way
- 1565 Bramble Bush Way
- 1140 Easy St
- 1580 Bramble Bush Way
- 1112 Bartlett Trace
- 1104 Bartlett Trace
- 1101 Bartlett Trace
- 940 Ambleside Dr
- 740 Mayfair Ct
- 245 Mayfair Ct
- 255 Mayfair Ct
- 104 Riverview Dr
- 915 Taylor Pkwy
- 1310 Settles Rd
- 1685 Thunder Gulch Pass
- 1690 Thunder Gulch Pass
- 1715 Thunder Gulch Pass
- 1710 Thunder Gulch Pass
- 1675 Thunder Gulch Pass
- 1725 Thunder Gulch Pass
- 1720 Thunder Gulch Pass
- 1670 Thunder Gulch Pass
- 1660 Johnstown Trace
- 1655 Thunder Gulch Pass
- 1670 Johnstown Trace
- 1730 Thunder Gulch Pass
- 1660 Thunder Gulch Pass
- 1735 Thunder Gulch Pass
- 1650 Johnstown Trace
- 1665 Johnstown Trace
- 1740 Thunder Gulch Pass
- 1640 Johnstown Trace
- 1650 Thunder Gulch Pass
- 1655 Johnstown Trace