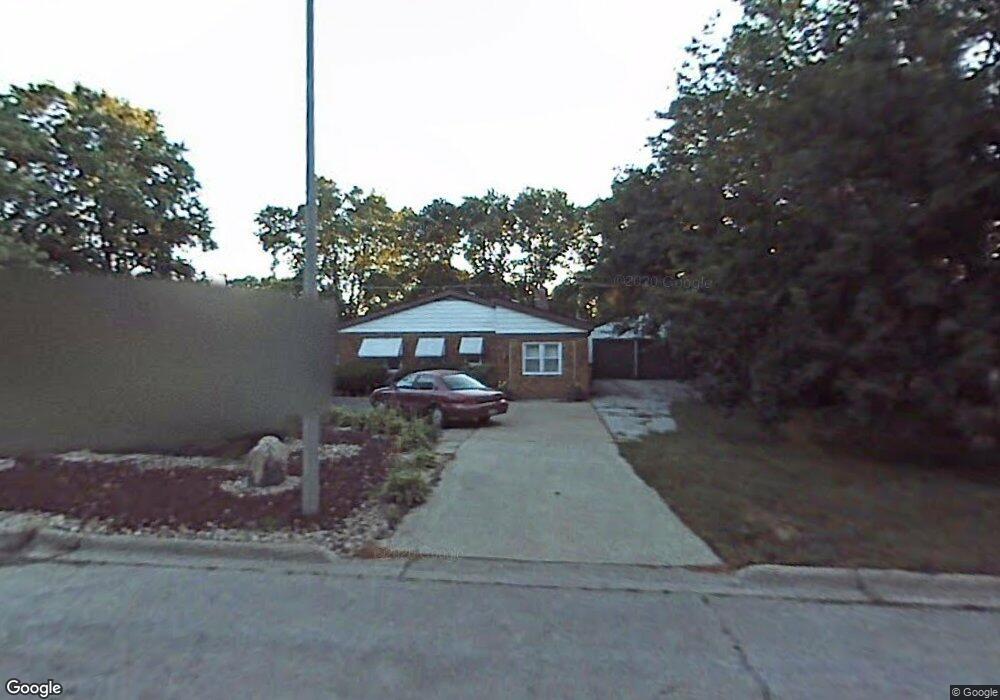
16954 Annetta Ave Hazel Crest, IL 60429
Hazel Crest Proper NeighborhoodEstimated Value: $141,000 - $212,000
4
Beds
3
Baths
2,578
Sq Ft
$67/Sq Ft
Est. Value
About This Home
This home is located at 16954 Annetta Ave, Hazel Crest, IL 60429 and is currently estimated at $172,446, approximately $66 per square foot. 16954 Annetta Ave is a home located in Cook County with nearby schools including Hillcrest High School.
Ownership History
Date
Name
Owned For
Owner Type
Purchase Details
Closed on
Apr 25, 2005
Sold by
Fumbanks James E and Fumbanks Bernadette
Bought by
Gilbert Gutierrez Julia and Gilbert Tracy
Current Estimated Value
Home Financials for this Owner
Home Financials are based on the most recent Mortgage that was taken out on this home.
Original Mortgage
$125,910
Outstanding Balance
$66,576
Interest Rate
6.06%
Mortgage Type
FHA
Estimated Equity
$105,870
Purchase Details
Closed on
Aug 18, 1997
Sold by
Hud
Bought by
Fumbanks James and Fumbanks Bernadette
Home Financials for this Owner
Home Financials are based on the most recent Mortgage that was taken out on this home.
Original Mortgage
$74,876
Interest Rate
7.54%
Mortgage Type
FHA
Purchase Details
Closed on
Oct 14, 1994
Sold by
Jacobi Jonathan P and Jacobi Diane M
Bought by
Huffman Sally J
Home Financials for this Owner
Home Financials are based on the most recent Mortgage that was taken out on this home.
Original Mortgage
$84,407
Interest Rate
8.55%
Mortgage Type
FHA
Create a Home Valuation Report for This Property
The Home Valuation Report is an in-depth analysis detailing your home's value as well as a comparison with similar homes in the area
Home Values in the Area
Average Home Value in this Area
Purchase History
| Date | Buyer | Sale Price | Title Company |
|---|---|---|---|
| Gilbert Gutierrez Julia | $128,000 | Cti | |
| Fumbanks James | -- | -- | |
| Huffman Sally J | $127,500 | First American Title |
Source: Public Records
Mortgage History
| Date | Status | Borrower | Loan Amount |
|---|---|---|---|
| Open | Gilbert Gutierrez Julia | $125,910 | |
| Previous Owner | Fumbanks James | $74,876 | |
| Previous Owner | Huffman Sally J | $84,407 |
Source: Public Records
Tax History Compared to Growth
Tax History
| Year | Tax Paid | Tax Assessment Tax Assessment Total Assessment is a certain percentage of the fair market value that is determined by local assessors to be the total taxable value of land and additions on the property. | Land | Improvement |
|---|---|---|---|---|
| 2024 | $2,572 | $4,595 | $743 | $3,852 |
| 2023 | $4,412 | $4,595 | $743 | $3,852 |
| 2022 | $4,412 | $5,743 | $743 | $5,000 |
| 2021 | $1,489 | $1,981 | $742 | $1,239 |
| 2020 | $1,402 | $1,981 | $742 | $1,239 |
| 2019 | $1,320 | $1,899 | $660 | $1,239 |
| 2018 | $1,297 | $1,899 | $660 | $1,239 |
| 2017 | $1,266 | $1,899 | $660 | $1,239 |
| 2016 | $1,128 | $1,816 | $577 | $1,239 |
| 2015 | $1,094 | $1,816 | $577 | $1,239 |
| 2014 | $1,092 | $1,816 | $577 | $1,239 |
| 2013 | $989 | $1,816 | $577 | $1,239 |
Source: Public Records
Map
Nearby Homes
- 16919 Western Ave
- 16913 Western Ave
- 17043 Annetta Ave
- 16846 Orchard Ridge Ave
- 16969 Orchard Ridge Ave
- 16751 Western Ave
- 16784 Anthony Ave
- 16732 Orchard Ridge Ave
- 16927 Crane Ave
- 16784 Crane Ave
- 16876 Head Ave
- 16742 Crane Ave
- 16879 Head Ave
- 16780 Head Ave
- 2131 170th St
- 16726 Head Ave
- 2191 171st St
- 16727 Head Ave
- 16744 Trapet Ave
- 16840 Bulger Ave
- 16954 Annetta Ave
- 16954 Annetta Ave
- 16962 Annetta Ave
- 16962 Annetta Ave
- 16934 Annetta Ave
- 16943 Murphy Ave
- 16949 Murphy Ave
- 16955 Murphy Ave
- 16935 Murphy Ave
- 16926 Annetta Ave
- 16927 Murphy Ave
- 16963 Murphy Ave
- 16919 Murphy Ave
- 2426 170th St
- 2426 170th St
- 2422 170th St
- 2422 170th St
- 2430 170th St
- 2430 170th St
- 16910 Annetta Ave