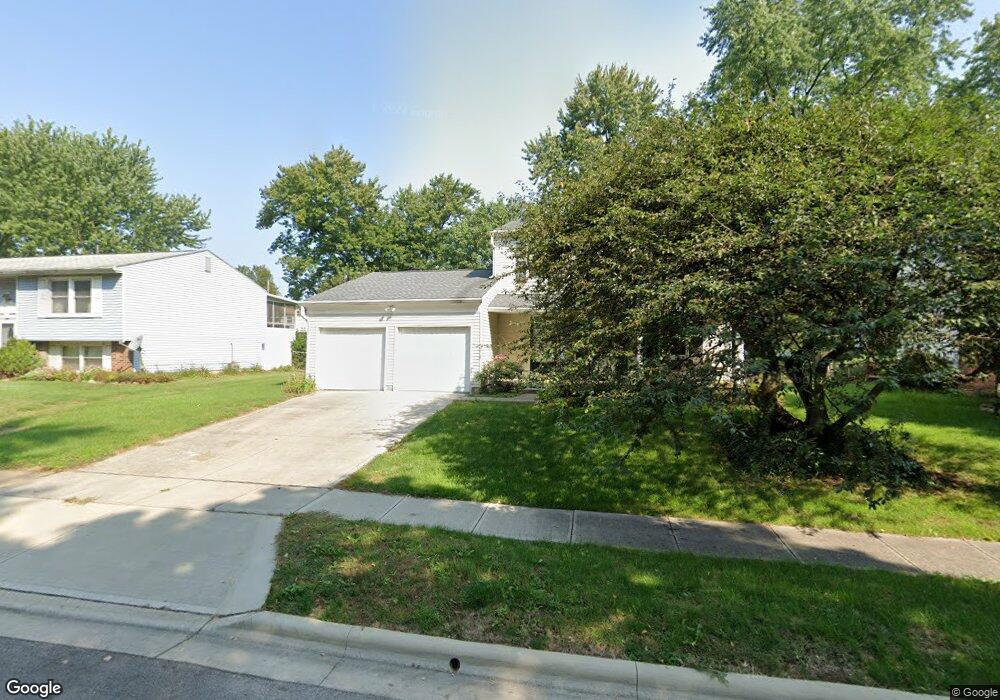
1696 Gypsy Ln Columbus, OH 43229
Northgate NeighborhoodEstimated Value: $291,857 - $321,000
3
Beds
2
Baths
1,540
Sq Ft
$198/Sq Ft
Est. Value
About This Home
This home is located at 1696 Gypsy Ln, Columbus, OH 43229 and is currently estimated at $304,714, approximately $197 per square foot. 1696 Gypsy Ln is a home located in Franklin County with nearby schools including Alpine Elementary School, Northgate Intermediate, and Woodward Park Middle School.
Ownership History
Date
Name
Owned For
Owner Type
Purchase Details
Closed on
Jul 13, 2001
Sold by
Hennessy Todd P and Hennessy Terri L
Bought by
Harshman Gregory A and Harshman Deborah L
Current Estimated Value
Home Financials for this Owner
Home Financials are based on the most recent Mortgage that was taken out on this home.
Original Mortgage
$124,002
Outstanding Balance
$47,857
Interest Rate
7.16%
Mortgage Type
FHA
Estimated Equity
$256,857
Purchase Details
Closed on
Jul 8, 1999
Sold by
Rana Rakesh and Rana Renu
Bought by
Hennessy Todd P and Hennessy Terri L
Home Financials for this Owner
Home Financials are based on the most recent Mortgage that was taken out on this home.
Original Mortgage
$99,744
Interest Rate
7.28%
Mortgage Type
FHA
Purchase Details
Closed on
Feb 15, 1985
Bought by
Rana Rakesh
Purchase Details
Closed on
Jul 1, 1984
Purchase Details
Closed on
Jul 1, 1979
Create a Home Valuation Report for This Property
The Home Valuation Report is an in-depth analysis detailing your home's value as well as a comparison with similar homes in the area
Home Values in the Area
Average Home Value in this Area
Purchase History
| Date | Buyer | Sale Price | Title Company |
|---|---|---|---|
| Harshman Gregory A | $125,000 | Chicago Title West | |
| Hennessy Todd P | $99,800 | Capital Title | |
| Rana Rakesh | $46,800 | -- | |
| -- | $65,000 | -- | |
| -- | $57,000 | -- |
Source: Public Records
Mortgage History
| Date | Status | Borrower | Loan Amount |
|---|---|---|---|
| Open | Harshman Gregory A | $124,002 | |
| Closed | Hennessy Todd P | $99,744 |
Source: Public Records
Tax History Compared to Growth
Tax History
| Year | Tax Paid | Tax Assessment Tax Assessment Total Assessment is a certain percentage of the fair market value that is determined by local assessors to be the total taxable value of land and additions on the property. | Land | Improvement |
|---|---|---|---|---|
| 2024 | $4,090 | $91,140 | $21,840 | $69,300 |
| 2023 | $4,038 | $91,140 | $21,840 | $69,300 |
| 2022 | $3,057 | $58,940 | $14,980 | $43,960 |
| 2021 | $3,062 | $58,940 | $14,980 | $43,960 |
| 2020 | $3,066 | $58,940 | $14,980 | $43,960 |
| 2019 | $2,848 | $46,940 | $12,010 | $34,930 |
| 2018 | $2,581 | $46,940 | $12,010 | $34,930 |
| 2017 | $2,701 | $46,940 | $12,010 | $34,930 |
| 2016 | $2,556 | $38,580 | $8,650 | $29,930 |
| 2015 | $2,320 | $38,580 | $8,650 | $29,930 |
| 2014 | $2,326 | $38,580 | $8,650 | $29,930 |
| 2013 | $1,274 | $42,840 | $9,590 | $33,250 |
Source: Public Records
Map
Nearby Homes
- 6407 Skywae Dr
- 6458 Faircrest Rd
- 6342 Bellmeadow Dr
- 1635 Tendril Ct
- 6407 Faircrest Rd
- 6355 Johnanne St
- 6496 Hearthstone Ave
- 1755 Hillandale Ave
- 6245 Sharon Woods Blvd
- 1421 Bosworth Place
- 1409 Bosworth Place
- 1947 Rockdale Dr Unit 33
- 1549 Alpine Dr
- 6448 Sharon Woods Blvd Unit B
- 1322 Bolenhill Ct
- 1294 Clydesdale Ct
- 2120 Willowick Dr Unit B
- 1268 Kildale Ct
- 6035 Karl Rd
- 1288 Oakfield Dr N
- 1688 Gypsy Ln
- 1708 Gypsy Ln
- 1697 Peardale Rd N
- 1680 Gypsy Ln
- 1716 Gypsy Ln
- 1707 Peardale Rd N
- 1703 Gypsy Ln
- 1679 Peardale Rd N
- 1717 Peardale Rd N
- 1687 Gypsy Ln
- 1670 Gypsy Ln
- 1711 Gypsy Ln
- 1730 Gypsy Ln
- 1679 Gypsy Ln
- 1671 Peardale Rd N
- 6435 Peardale Rd E
- 1723 Gypsy Ln
- 1719 Peardale Rd N
- 1664 Gypsy Ln
- 1667 Gypsy Ln