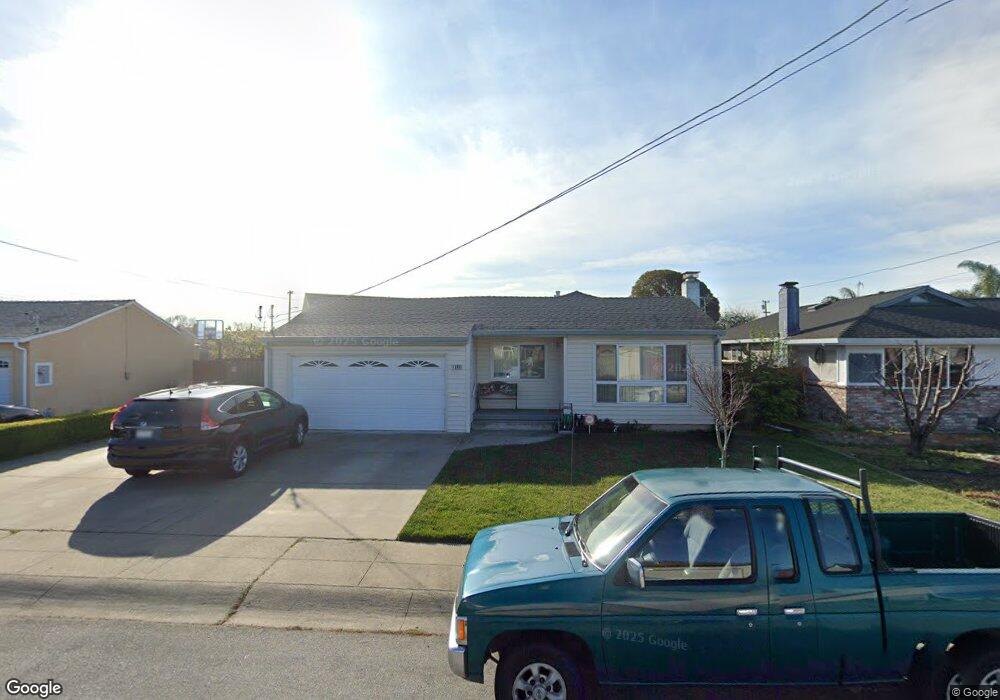
1696 Via Toyon San Lorenzo, CA 94580
Estimated Value: $839,000 - $915,000
3
Beds
2
Baths
1,402
Sq Ft
$624/Sq Ft
Est. Value
About This Home
This home is located at 1696 Via Toyon, San Lorenzo, CA 94580 and is currently estimated at $875,480, approximately $624 per square foot. 1696 Via Toyon is a home located in Alameda County with nearby schools including Bay Elementary School, Bohannon Middle School, and Arroyo High School.
Ownership History
Date
Name
Owned For
Owner Type
Purchase Details
Closed on
May 29, 2001
Sold by
Lecount Arlen R
Bought by
Duenas Jaime and Duenas Bertha
Current Estimated Value
Home Financials for this Owner
Home Financials are based on the most recent Mortgage that was taken out on this home.
Original Mortgage
$255,000
Outstanding Balance
$97,205
Interest Rate
7.15%
Estimated Equity
$778,275
Purchase Details
Closed on
Mar 24, 2000
Sold by
Arnold Wesley T
Bought by
Fries Patricia M
Purchase Details
Closed on
Oct 12, 1999
Sold by
Arnold Teresa J
Bought by
Arnold Wesley T
Purchase Details
Closed on
Feb 1, 1994
Sold by
Ferry Fries Patricia
Bought by
Arnold Wesley T and Arnold Teresa J
Home Financials for this Owner
Home Financials are based on the most recent Mortgage that was taken out on this home.
Original Mortgage
$100,000
Interest Rate
7.1%
Create a Home Valuation Report for This Property
The Home Valuation Report is an in-depth analysis detailing your home's value as well as a comparison with similar homes in the area
Home Values in the Area
Average Home Value in this Area
Purchase History
| Date | Buyer | Sale Price | Title Company |
|---|---|---|---|
| Duenas Jaime | $320,000 | Placer Title Company | |
| Lecount Arlen R | $220,000 | Placer Title Company | |
| Fries Patricia M | -- | -- | |
| Arnold Wesley T | -- | -- | |
| Arnold Wesley T | $50,000 | North American Title Co Inc |
Source: Public Records
Mortgage History
| Date | Status | Borrower | Loan Amount |
|---|---|---|---|
| Open | Duenas Jaime | $255,000 | |
| Previous Owner | Arnold Wesley T | $100,000 | |
| Closed | Duenas Jaime | $32,000 |
Source: Public Records
Tax History Compared to Growth
Tax History
| Year | Tax Paid | Tax Assessment Tax Assessment Total Assessment is a certain percentage of the fair market value that is determined by local assessors to be the total taxable value of land and additions on the property. | Land | Improvement |
|---|---|---|---|---|
| 2025 | $6,325 | $475,152 | $135,605 | $346,547 |
| 2024 | $6,325 | $465,700 | $132,947 | $339,753 |
| 2023 | $6,296 | $463,432 | $130,340 | $333,092 |
| 2022 | $6,200 | $447,348 | $127,785 | $326,563 |
| 2021 | $6,028 | $438,440 | $125,280 | $320,160 |
| 2020 | $5,896 | $440,872 | $123,995 | $316,877 |
| 2019 | $5,901 | $432,229 | $121,564 | $310,665 |
| 2018 | $5,567 | $423,756 | $119,181 | $304,575 |
| 2017 | $5,313 | $415,449 | $116,845 | $298,604 |
| 2016 | $5,068 | $407,304 | $114,554 | $292,750 |
| 2015 | $4,957 | $401,189 | $112,834 | $288,355 |
| 2014 | $4,883 | $393,334 | $110,625 | $282,709 |
Source: Public Records
Map
Nearby Homes
- 1766 Via Redondo
- 1575 Via Lucas
- 1631 Via Ventana
- 1608 Keller Ave
- 1655 Via Escondido
- 1338 Via la Paloma
- 1311 Via Manzanas
- 1781 Via Rancho
- 17069 Via Chiquita
- 15771 Via Nueva
- 1867 Via Buena Vista
- 17354 Via el Cerrito
- 16050 Via Olinda
- 0 E 14th St Unit 41059501
- 15967 Paseo Del Campo
- 16011 Via Conejo
- 987 Via Bregani
- 17316 Via Flores
- 17347 Via Encinas
- 840 Woodgate Dr