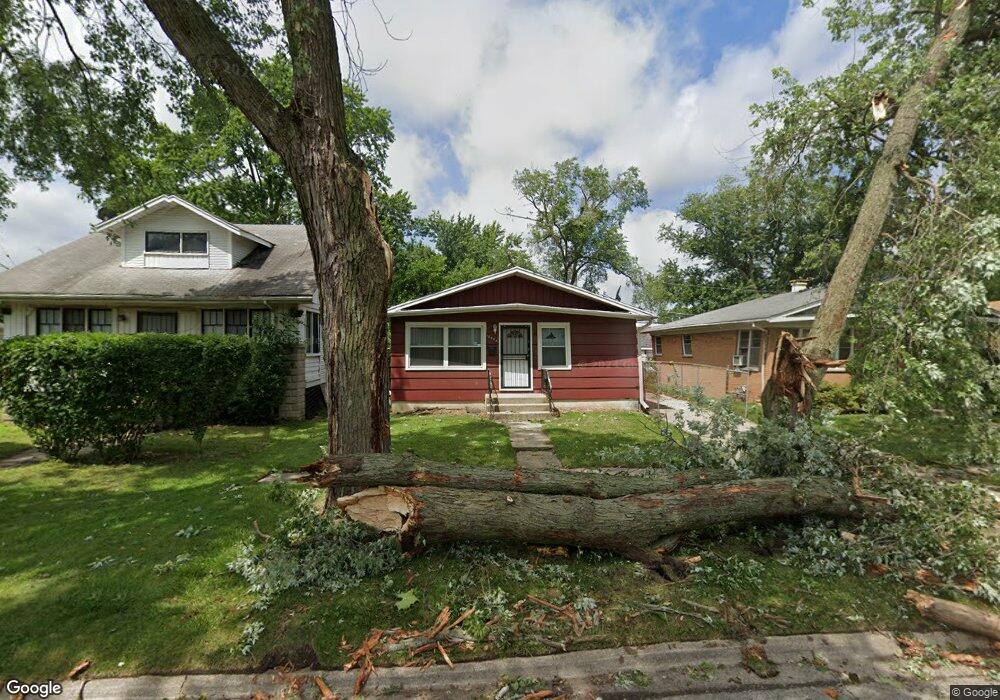
16964 Orchard Ridge Ave Hazel Crest, IL 60429
Hazel Crest Proper NeighborhoodEstimated Value: $115,000 - $165,000
2
Beds
1
Bath
1,040
Sq Ft
$144/Sq Ft
Est. Value
About This Home
This home is located at 16964 Orchard Ridge Ave, Hazel Crest, IL 60429 and is currently estimated at $149,521, approximately $143 per square foot. 16964 Orchard Ridge Ave is a home located in Cook County with nearby schools including Thornwood High School.
Ownership History
Date
Name
Owned For
Owner Type
Purchase Details
Closed on
Mar 13, 2012
Sold by
Friendly Properties
Bought by
Iuliano John
Current Estimated Value
Purchase Details
Closed on
Feb 10, 2012
Sold by
Citimortgage Incorporated
Bought by
Friendly Properties
Purchase Details
Closed on
Oct 11, 2011
Sold by
Rush Grady J
Bought by
Citimortgage Incorporated
Purchase Details
Closed on
Apr 16, 2007
Sold by
Rush Grady and Rush Overia
Bought by
Walker Beverly
Purchase Details
Closed on
Oct 29, 2004
Sold by
Chicago Title Land Trust Co
Bought by
Rush Grady J
Home Financials for this Owner
Home Financials are based on the most recent Mortgage that was taken out on this home.
Original Mortgage
$95,380
Interest Rate
5.8%
Mortgage Type
New Conventional
Purchase Details
Closed on
Apr 23, 2004
Sold by
Wells Fargo Bank Minnesota Na
Bought by
Chicago Title Land Trust Co and Trust #17315
Purchase Details
Closed on
Mar 8, 2004
Sold by
Matos Katherine M
Bought by
Wells Fargo Bank Minnesota Na
Create a Home Valuation Report for This Property
The Home Valuation Report is an in-depth analysis detailing your home's value as well as a comparison with similar homes in the area
Home Values in the Area
Average Home Value in this Area
Purchase History
| Date | Buyer | Sale Price | Title Company |
|---|---|---|---|
| Iuliano John | -- | Fatic | |
| Friendly Properties | $25,000 | Fatic | |
| Citimortgage Incorporated | -- | None Available | |
| Walker Beverly | -- | None Available | |
| Rush Grady J | $100,500 | -- | |
| Chicago Title Land Trust Co | $50,000 | First American | |
| Wells Fargo Bank Minnesota Na | -- | Torrens Title |
Source: Public Records
Mortgage History
| Date | Status | Borrower | Loan Amount |
|---|---|---|---|
| Previous Owner | Rush Grady J | $95,380 |
Source: Public Records
Tax History Compared to Growth
Tax History
| Year | Tax Paid | Tax Assessment Tax Assessment Total Assessment is a certain percentage of the fair market value that is determined by local assessors to be the total taxable value of land and additions on the property. | Land | Improvement |
|---|---|---|---|---|
| 2024 | $4,739 | $7,401 | $1,809 | $5,592 |
| 2023 | $4,340 | $7,401 | $1,809 | $5,592 |
| 2022 | $4,340 | $5,014 | $1,550 | $3,464 |
| 2021 | $4,219 | $5,013 | $1,550 | $3,463 |
| 2020 | $3,955 | $5,013 | $1,550 | $3,463 |
| 2019 | $4,847 | $6,198 | $1,420 | $4,778 |
| 2018 | $4,717 | $6,198 | $1,420 | $4,778 |
| 2017 | $4,564 | $6,198 | $1,420 | $4,778 |
| 2016 | $4,473 | $6,619 | $1,291 | $5,328 |
| 2015 | $4,340 | $6,619 | $1,291 | $5,328 |
| 2014 | $4,286 | $6,619 | $1,291 | $5,328 |
| 2013 | $4,227 | $7,158 | $1,291 | $5,867 |
Source: Public Records
Map
Nearby Homes
- 16969 Orchard Ridge Ave
- 16919 Western Ave
- 16913 Western Ave
- 16927 Crane Ave
- 17043 Annetta Ave
- 16846 Orchard Ridge Ave
- 16876 Head Ave
- 2131 170th St
- 16879 Head Ave
- 16784 Anthony Ave
- 16784 Crane Ave
- 2191 171st St
- 16751 Western Ave
- 16780 Head Ave
- 17026 Bulger Ave
- 16742 Crane Ave
- 16732 Orchard Ridge Ave
- 16840 Bulger Ave
- 2030 170th St
- 16726 Head Ave
- 16958 Orchard Ridge Ave
- 16968 Orchard Ridge Ave
- 16950 Orchard Ridge Ave
- 16942 Orchard Ridge Ave
- 16965 Western Ave
- 16965 Western Ave
- 16959 Western Ave
- 2330 170th St
- 2330 170th St
- 16973 Western Ave
- 2320 170th St
- 2320 170th St
- 16938 Orchard Ridge Ave
- 16943 Western Ave
- 16943 Western Ave
- 16969 Orchard Ridge Ave
- 2340 170th St
- 2340 170th St
- 16924 Orchard Ridge Ave