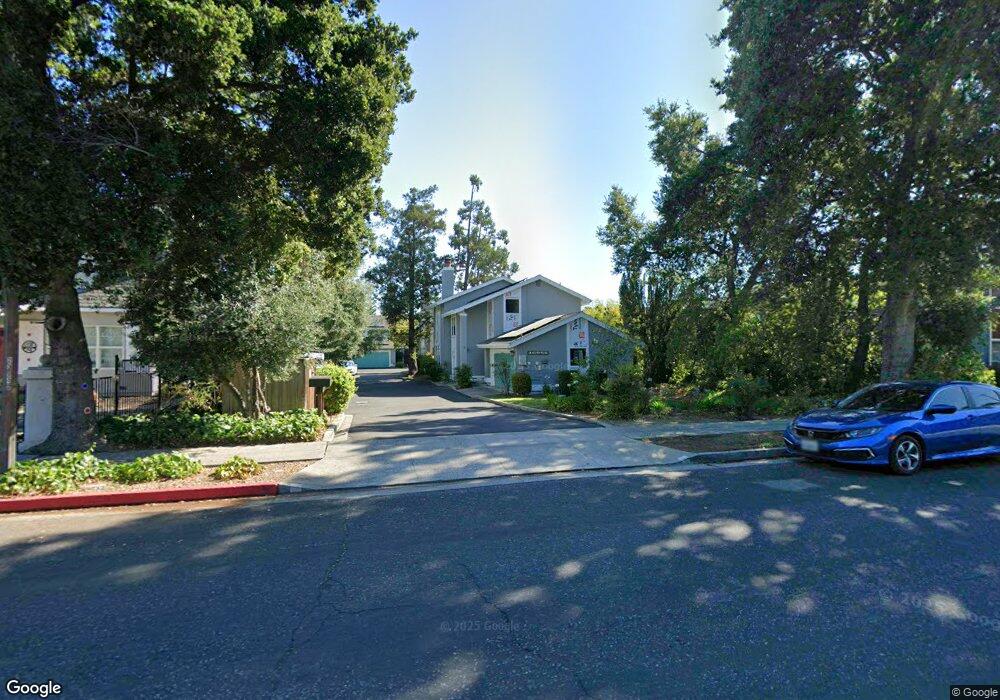
16965 Roberts Rd Unit D Los Gatos, CA 95032
East Los Gatos NeighborhoodEstimated Value: $1,637,311 - $1,867,000
3
Beds
2
Baths
1,706
Sq Ft
$1,021/Sq Ft
Est. Value
About This Home
This home is located at 16965 Roberts Rd Unit D, Los Gatos, CA 95032 and is currently estimated at $1,741,828, approximately $1,021 per square foot. 16965 Roberts Rd Unit D is a home located in Santa Clara County with nearby schools including Louise Van Meter Elementary School, Loma Prieta Elementary School, and Raymond J. Fisher Middle School.
Ownership History
Date
Name
Owned For
Owner Type
Purchase Details
Closed on
Nov 18, 2016
Sold by
Peacock Melinda Gott
Bought by
Peacock Melinda Gott
Current Estimated Value
Home Financials for this Owner
Home Financials are based on the most recent Mortgage that was taken out on this home.
Original Mortgage
$417,000
Interest Rate
3.52%
Mortgage Type
New Conventional
Purchase Details
Closed on
Jan 31, 2014
Sold by
Peacock Melinda Gott
Bought by
Peacock Melinda Gott
Home Financials for this Owner
Home Financials are based on the most recent Mortgage that was taken out on this home.
Original Mortgage
$465,000
Interest Rate
4.49%
Mortgage Type
New Conventional
Purchase Details
Closed on
Jun 4, 2013
Sold by
Shafie Afshin and Kosanovich Felicia Hope
Bought by
Peacock Melinda Gott and The Melinda Gott Peacock Living Trust
Purchase Details
Closed on
Nov 11, 2011
Sold by
Shafie Afshin and Kosanovich Felicia
Bought by
Shafie Afshin and Kosanovich Felicia Hope
Home Financials for this Owner
Home Financials are based on the most recent Mortgage that was taken out on this home.
Original Mortgage
$535,000
Interest Rate
4.5%
Mortgage Type
New Conventional
Purchase Details
Closed on
Aug 8, 2005
Sold by
Shah Mamta
Bought by
Shafie Afshin and Kosanovich Felicia
Home Financials for this Owner
Home Financials are based on the most recent Mortgage that was taken out on this home.
Original Mortgage
$460,000
Interest Rate
5.75%
Mortgage Type
Purchase Money Mortgage
Purchase Details
Closed on
Mar 26, 2002
Sold by
Sweeney David P and Hotell Marta S
Bought by
Shah Mamta
Home Financials for this Owner
Home Financials are based on the most recent Mortgage that was taken out on this home.
Original Mortgage
$463,200
Interest Rate
6.12%
Purchase Details
Closed on
Jul 9, 1997
Sold by
Sweeney David P and Hotell Marta S
Bought by
Sweeney David P and Hotell Marta S
Purchase Details
Closed on
Jun 30, 1995
Sold by
Sheehan Richard J
Bought by
Sweeney David P and Hotell Marta S
Home Financials for this Owner
Home Financials are based on the most recent Mortgage that was taken out on this home.
Original Mortgage
$262,200
Interest Rate
7.88%
Create a Home Valuation Report for This Property
The Home Valuation Report is an in-depth analysis detailing your home's value as well as a comparison with similar homes in the area
Home Values in the Area
Average Home Value in this Area
Purchase History
| Date | Buyer | Sale Price | Title Company |
|---|---|---|---|
| Peacock Melinda Gott | -- | Accommodation | |
| Peacock Melinda Gott | -- | Service Link | |
| Peacock Melinda Gott | -- | North American Title Co Inc | |
| Peacock Melinda Gott | -- | North American Title Co Inc | |
| Peacock Melinda Gott | $955,000 | Old Republic Title Company | |
| Shafie Afshin | -- | Fidelity National Title Co | |
| Shafie Afshin | $760,000 | Financial Title Company | |
| Shah Mamta | $579,000 | North American Title Co | |
| Sweeney David P | -- | -- | |
| Sweeney David P | $276,000 | Old Republic Title |
Source: Public Records
Mortgage History
| Date | Status | Borrower | Loan Amount |
|---|---|---|---|
| Open | Peacock Melinda Gott | $334,000 | |
| Closed | Peacock Melinda Gott | $338,800 | |
| Closed | Peacock Melinda Gott | $417,000 | |
| Closed | Peacock Melinda Gott | $460,000 | |
| Closed | Peacock Melinda Gott | $465,000 | |
| Previous Owner | Shafie Afshin | $535,000 | |
| Previous Owner | Shafie Afshin | $440,000 | |
| Previous Owner | Shafie Afshin | $460,000 | |
| Previous Owner | Shah Mamta | $75,000 | |
| Previous Owner | Shah Mamta | $465,000 | |
| Previous Owner | Shah Mamta | $463,200 | |
| Previous Owner | Sweeney David P | $326,250 | |
| Previous Owner | Sweeney David P | $262,200 | |
| Closed | Shah Mamta | $57,700 |
Source: Public Records
Tax History Compared to Growth
Tax History
| Year | Tax Paid | Tax Assessment Tax Assessment Total Assessment is a certain percentage of the fair market value that is determined by local assessors to be the total taxable value of land and additions on the property. | Land | Improvement |
|---|---|---|---|---|
| 2024 | $14,154 | $1,152,944 | $576,472 | $576,472 |
| 2023 | $13,875 | $1,130,338 | $565,169 | $565,169 |
| 2022 | $13,792 | $1,108,176 | $554,088 | $554,088 |
| 2021 | $13,537 | $1,086,448 | $543,224 | $543,224 |
| 2020 | $13,289 | $1,075,308 | $537,654 | $537,654 |
| 2019 | $13,101 | $1,054,224 | $527,112 | $527,112 |
| 2018 | $12,912 | $1,033,554 | $516,777 | $516,777 |
| 2017 | $12,870 | $1,013,290 | $506,645 | $506,645 |
| 2016 | $12,527 | $993,422 | $496,711 | $496,711 |
| 2015 | $12,435 | $978,500 | $489,250 | $489,250 |
| 2014 | $12,237 | $959,334 | $479,667 | $479,667 |
Source: Public Records
Map
Nearby Homes
- 16973 Roberts Rd
- 16218 George St
- 16897 Mitchell Ave
- 16345 Los Gatos Blvd Unit 33
- 449 Alberto Way Unit C138
- 443 Alberto Way Unit B115
- 168 Cuesta de Los Gatos
- 420 Alberto Way Unit 51
- 420 Alberto Way Unit 5
- 216 San Mateo Ave
- 137 Fairmead Ln
- 221 Creekside Village Dr
- 20 Mariposa Ave
- 230 San Mateo Ave
- 16251 Lilac Ln
- 120 Carlton Ave Unit 46
- 120 Carlton Ave Unit 23
- 247 Marchmont Dr
- 222 Bella Vista Ave
- 16460 B Bonnie Ln
- 16965 Roberts Rd Unit D
- 16965 Roberts Rd Unit C
- 16965 Roberts Rd Unit B
- 16965 Roberts Rd Unit A
- 16945 Roberts Rd
- 16929 Roberts Rd Unit 2
- 16979 Roberts Rd Unit 9
- 16979 Roberts Rd Unit 8
- 16979 Roberts Rd Unit 7
- 16979 Roberts Rd Unit 6
- 16979 Roberts Rd Unit 5
- 16979 Roberts Rd Unit 4
- 16979 Roberts Rd Unit 3
- 16979 Roberts Rd Unit 2
- 16979 Roberts Rd Unit 1
- 16927 Roberts Rd Unit 1
- 16931 Roberts Rd Unit 3
- 16935 Roberts Rd
- 710 Cilker Ct
- 720 Cilker Ct