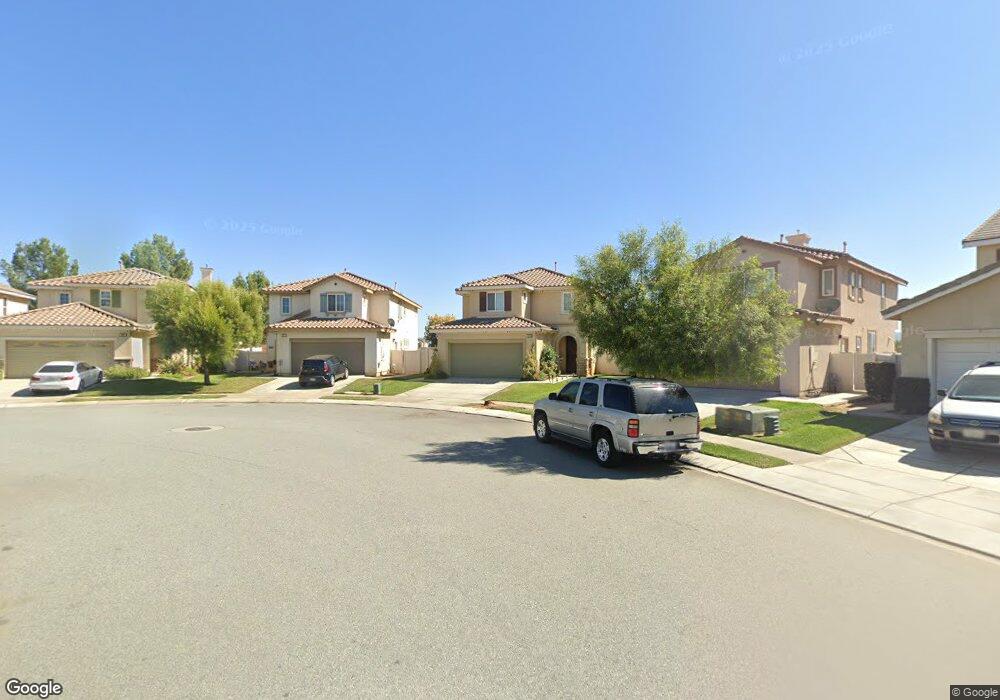
1699 Apollo Way Beaumont, CA 92223
Estimated Value: $485,000 - $544,847
4
Beds
3
Baths
2,141
Sq Ft
$244/Sq Ft
Est. Value
About This Home
This home is located at 1699 Apollo Way, Beaumont, CA 92223 and is currently estimated at $521,962, approximately $243 per square foot. 1699 Apollo Way is a home located in Riverside County with nearby schools including Sundance Elementary School, San Gorgonio Middle School, and Beaumont Senior High School.
Ownership History
Date
Name
Owned For
Owner Type
Purchase Details
Closed on
Mar 24, 2009
Sold by
Deutsche Bank National Trust Company
Bought by
Kinser Russell Welling and Kinser Katherine Suzanne
Current Estimated Value
Home Financials for this Owner
Home Financials are based on the most recent Mortgage that was taken out on this home.
Original Mortgage
$176,739
Outstanding Balance
$112,501
Interest Rate
5.15%
Mortgage Type
FHA
Estimated Equity
$409,461
Purchase Details
Closed on
Nov 10, 2008
Sold by
Centeno Victor C
Bought by
Deutsche Bank National Trust Company
Purchase Details
Closed on
Jan 27, 2006
Sold by
Pardee Homes
Bought by
Centeno Victor C
Home Financials for this Owner
Home Financials are based on the most recent Mortgage that was taken out on this home.
Original Mortgage
$271,700
Interest Rate
7.5%
Mortgage Type
Stand Alone First
Create a Home Valuation Report for This Property
The Home Valuation Report is an in-depth analysis detailing your home's value as well as a comparison with similar homes in the area
Home Values in the Area
Average Home Value in this Area
Purchase History
| Date | Buyer | Sale Price | Title Company |
|---|---|---|---|
| Kinser Russell Welling | $180,000 | First American Title Company | |
| Deutsche Bank National Trust Company | $170,909 | Accommodation | |
| Centeno Victor C | $340,000 | Chicago Title Company |
Source: Public Records
Mortgage History
| Date | Status | Borrower | Loan Amount |
|---|---|---|---|
| Open | Kinser Russell Welling | $176,739 | |
| Previous Owner | Centeno Victor C | $271,700 |
Source: Public Records
Tax History Compared to Growth
Tax History
| Year | Tax Paid | Tax Assessment Tax Assessment Total Assessment is a certain percentage of the fair market value that is determined by local assessors to be the total taxable value of land and additions on the property. | Land | Improvement |
|---|---|---|---|---|
| 2025 | $5,448 | $270,887 | $57,936 | $212,951 |
| 2023 | $5,448 | $260,370 | $55,687 | $204,683 |
| 2022 | $5,337 | $255,266 | $54,596 | $200,670 |
| 2021 | $5,273 | $250,262 | $53,526 | $196,736 |
| 2020 | $5,228 | $247,697 | $52,978 | $194,719 |
| 2019 | $5,160 | $242,841 | $51,940 | $190,901 |
| 2018 | $5,164 | $238,080 | $50,923 | $187,157 |
| 2017 | $4,846 | $199,713 | $49,925 | $149,788 |
| 2016 | $5,353 | $195,798 | $48,947 | $146,851 |
| 2015 | $5,258 | $192,860 | $48,213 | $144,647 |
| 2014 | $5,206 | $189,083 | $47,269 | $141,814 |
Source: Public Records
Map
Nearby Homes
- 1161 Richland Dr
- 1157 Blackbrush Way
- 1560 Polaris Ln
- 770 Allegheny St
- 5903 Banbury Ln
- 1525 Horizon Ave
- 5762 Verde Way
- 1489 Bottlebrush Ct
- 5758 Raven Way
- 925 Bluebell Way
- 1338 Smoke Tree Ln
- 5700 W Wilson St Unit 133
- 5700 W Wilson St Unit 3
- 5700 W Wilson St Unit 86
- 5700 W Wilson St Unit 42
- 5700 W Wilson St Unit 140
- 5700 W Wilson St Unit 102
- 5700 W Wilson St Unit 25
- 1371 Sunburst Dr
- 5751 Falcon Way