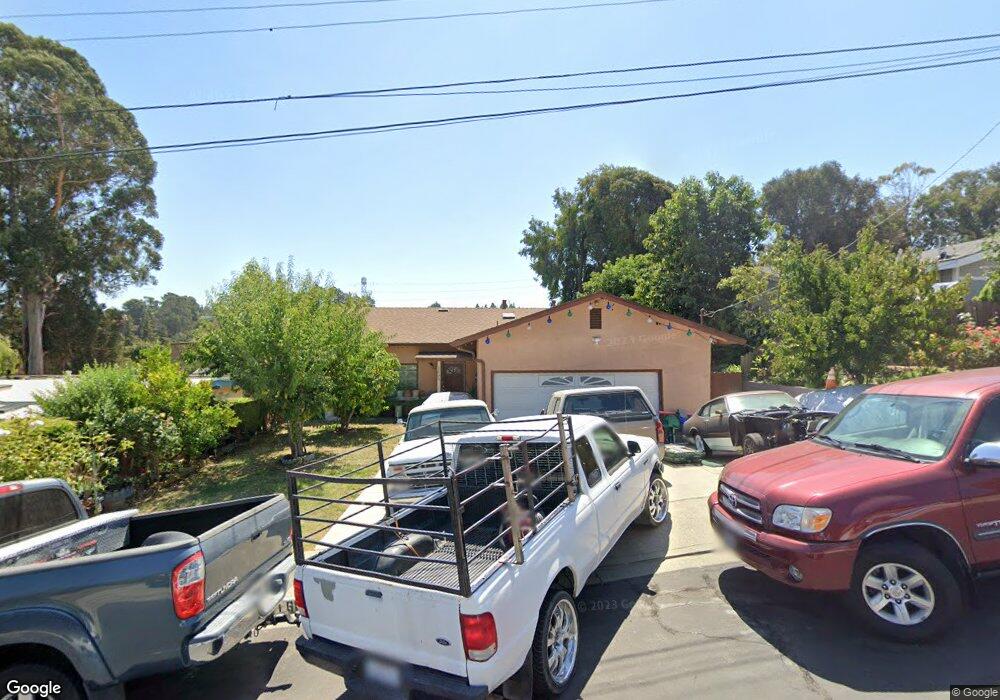
1699 El Toro Way Pinole, CA 94564
Gateley NeighborhoodEstimated Value: $695,000 - $894,000
3
Beds
2
Baths
1,648
Sq Ft
$470/Sq Ft
Est. Value
About This Home
This home is located at 1699 El Toro Way, Pinole, CA 94564 and is currently estimated at $775,320, approximately $470 per square foot. 1699 El Toro Way is a home located in Contra Costa County with nearby schools including Collins Elementary School, Pinole Middle School, and Pinole Valley High School.
Ownership History
Date
Name
Owned For
Owner Type
Purchase Details
Closed on
Aug 24, 2020
Sold by
Murillo Pedro
Bought by
Murillo Alicia M
Current Estimated Value
Purchase Details
Closed on
Dec 17, 2002
Sold by
Deprey Mitchell C and Deprey Bari G
Bought by
Murillo Pedro and Murillo Alicia M
Home Financials for this Owner
Home Financials are based on the most recent Mortgage that was taken out on this home.
Original Mortgage
$281,000
Outstanding Balance
$118,878
Interest Rate
6.03%
Mortgage Type
Purchase Money Mortgage
Estimated Equity
$656,442
Purchase Details
Closed on
Mar 16, 1999
Sold by
Brockett Lawrence E and Brockett Michele
Bought by
Deprey Mitchell C and Deprey Bari G
Home Financials for this Owner
Home Financials are based on the most recent Mortgage that was taken out on this home.
Original Mortgage
$186,200
Interest Rate
6.73%
Mortgage Type
Purchase Money Mortgage
Create a Home Valuation Report for This Property
The Home Valuation Report is an in-depth analysis detailing your home's value as well as a comparison with similar homes in the area
Home Values in the Area
Average Home Value in this Area
Purchase History
| Date | Buyer | Sale Price | Title Company |
|---|---|---|---|
| Murillo Alicia M | -- | None Available | |
| Murillo Pedro | $371,000 | Commonwealth Title | |
| Deprey Mitchell C | $196,000 | Commonwealth Land Title Co |
Source: Public Records
Mortgage History
| Date | Status | Borrower | Loan Amount |
|---|---|---|---|
| Open | Murillo Pedro | $281,000 | |
| Previous Owner | Deprey Mitchell C | $186,200 |
Source: Public Records
Tax History Compared to Growth
Tax History
| Year | Tax Paid | Tax Assessment Tax Assessment Total Assessment is a certain percentage of the fair market value that is determined by local assessors to be the total taxable value of land and additions on the property. | Land | Improvement |
|---|---|---|---|---|
| 2025 | $8,341 | $564,417 | $338,901 | $225,516 |
| 2024 | $8,136 | $553,351 | $332,256 | $221,095 |
| 2023 | $8,136 | $542,502 | $325,742 | $216,760 |
| 2022 | $8,065 | $531,865 | $319,355 | $212,510 |
| 2021 | $8,046 | $521,438 | $313,094 | $208,344 |
| 2019 | $7,494 | $505,973 | $303,808 | $202,165 |
| 2018 | $6,923 | $470,000 | $282,208 | $187,792 |
| 2017 | $6,522 | $440,000 | $264,195 | $175,805 |
| 2016 | $5,920 | $388,500 | $233,272 | $155,228 |
| 2015 | $5,799 | $373,500 | $224,265 | $149,235 |
| 2014 | $5,085 | $315,000 | $189,139 | $125,861 |
Source: Public Records
Map
Nearby Homes
- 0 Appian Way Unit 41031165
- 1566 Mann Dr
- 1310 Lewis Ln
- 1441 Wallace Ct
- 1655 Marlesta Rd
- 1880 Tesoro Ct
- 1703 Dalessi Dr
- 948 Jones Ave
- 209 N Rancho Place
- 767 Marlesta Rd
- 1051 Saint Andrews Dr
- 1139 San Pablo Ave
- 2180 Shea Dr
- 924 E Meadow Ave
- 923 Kelvin Rd
- 815 San Pablo Ave
- 594 Summit Dr
- 1200 Bay View Farm Rd
- 2940 Estates Ave Unit 7
- 111 Dursey Dr Unit 111
- 1689 El Toro Way
- 1707 El Toro Way
- 1679 El Toro Way
- 1717 El Toro Way
- 1698 El Toro Way
- 1706 El Toro Way
- 1688 El Toro Way
- 1726 El Toro Way
- 1669 El Toro Way
- 1727 El Toro Way
- 1678 El Toro Way
- 1670 Poquito Ct
- 1736 El Toro Way
- 1737 El Toro Way
- 1668 Poquito Ct
- 1668 El Toro Way
- 1669 Poquito Ct
- 1746 El Toro Way
- 1659 El Toro Way
- 1747 El Toro Way