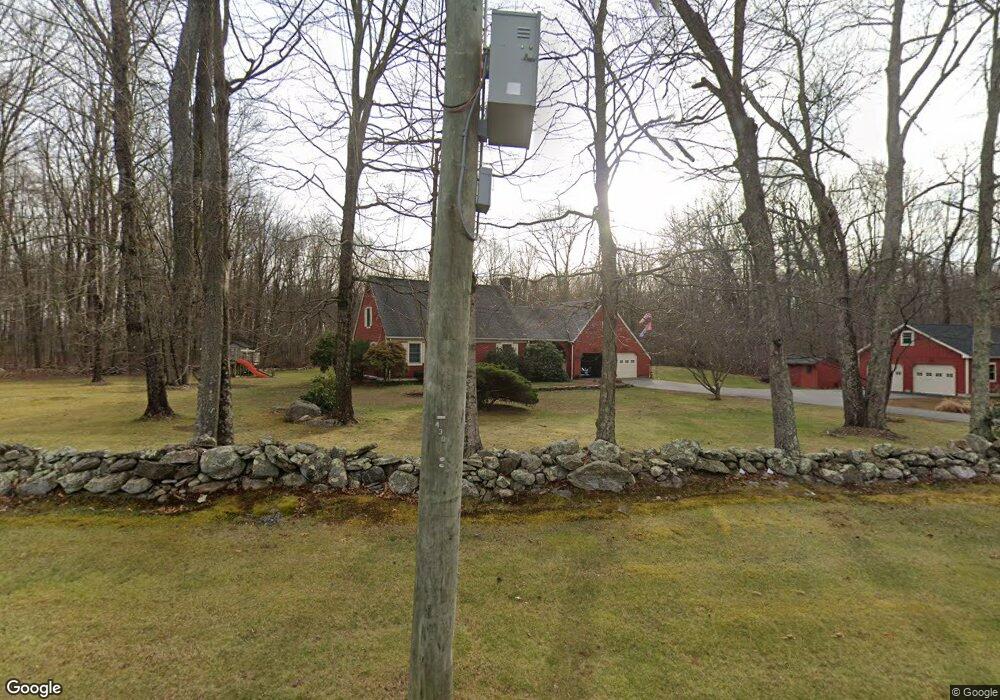
1699 South St Coventry, CT 06238
Estimated Value: $421,813 - $498,000
3
Beds
2
Baths
1,656
Sq Ft
$272/Sq Ft
Est. Value
About This Home
This home is located at 1699 South St, Coventry, CT 06238 and is currently estimated at $450,953, approximately $272 per square foot. 1699 South St is a home located in Tolland County with nearby schools including George Hersey Robertson School, Coventry Grammar School, and Capt. Nathan Hale School.
Ownership History
Date
Name
Owned For
Owner Type
Purchase Details
Closed on
Jun 15, 2020
Sold by
Hodgkins Ronald W and Hodgkins Linda A
Bought by
Hodgkins Lt and Hodgkins
Current Estimated Value
Purchase Details
Closed on
Aug 12, 1983
Bought by
Hodgkins Ronald W
Create a Home Valuation Report for This Property
The Home Valuation Report is an in-depth analysis detailing your home's value as well as a comparison with similar homes in the area
Home Values in the Area
Average Home Value in this Area
Purchase History
| Date | Buyer | Sale Price | Title Company |
|---|---|---|---|
| Hodgkins Lt | -- | None Available | |
| Hodgkins Lt | -- | None Available | |
| Hodgkins Ronald W | -- | -- |
Source: Public Records
Mortgage History
| Date | Status | Borrower | Loan Amount |
|---|---|---|---|
| Previous Owner | Hodgkins Ronald W | $180,000 | |
| Previous Owner | Hodgkins Ronald W | $175,000 | |
| Previous Owner | Hodgkins Ronald W | $175,000 | |
| Previous Owner | Hodgkins Ronald W | $45,000 |
Source: Public Records
Tax History Compared to Growth
Tax History
| Year | Tax Paid | Tax Assessment Tax Assessment Total Assessment is a certain percentage of the fair market value that is determined by local assessors to be the total taxable value of land and additions on the property. | Land | Improvement |
|---|---|---|---|---|
| 2025 | $6,871 | $289,200 | $56,100 | $233,100 |
| 2024 | $5,903 | $177,200 | $48,800 | $128,400 |
| 2023 | $5,624 | $177,200 | $48,800 | $128,400 |
| 2022 | $5,345 | $171,600 | $48,800 | $122,800 |
| 2021 | $5,345 | $171,600 | $48,800 | $122,800 |
| 2020 | $5,349 | $171,600 | $48,800 | $122,800 |
| 2019 | $5,529 | $171,700 | $48,800 | $122,900 |
| 2018 | $4,785 | $148,600 | $48,800 | $99,800 |
| 2017 | $4,755 | $148,600 | $48,800 | $99,800 |
| 2016 | $4,636 | $148,600 | $48,800 | $99,800 |
| 2015 | $4,636 | $148,600 | $48,800 | $99,800 |
| 2014 | $4,683 | $164,500 | $60,400 | $104,100 |
Source: Public Records
Map
Nearby Homes
- 219 Reynolds Dr
- 1902 South St
- 83 Morin Ave
- 35 Birch Trail
- 198 Forest Rd
- 39 Wood Trail
- 17 Ireland Dr
- 48 Lakeview Dr
- 59 Woodland Rd
- 1365 Main St
- 122 High St
- 152 Cheney Ln
- 259 High St
- 94 Stonehouse Rd Unit 10
- 30 Knollwood Dr
- 581 Old Tolland Turnpike
- 220 Buena Vista Rd
- 00 Bunker Hill Rd
- 262 Cooper Ln
- 36 Cooper Ln