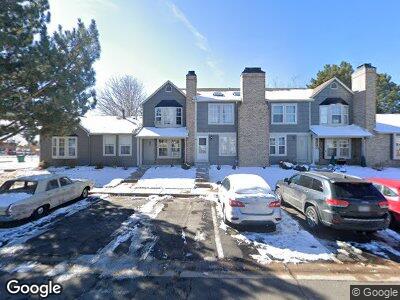
16996 E Piedmont Dr Unit F Aurora, CO 80015
Prides Crossing NeighborhoodEstimated Value: $270,000 - $300,000
2
Beds
1
Bath
784
Sq Ft
$363/Sq Ft
Est. Value
About This Home
This home is located at 16996 E Piedmont Dr Unit F, Aurora, CO 80015 and is currently estimated at $284,975, approximately $363 per square foot. 16996 E Piedmont Dr Unit F is a home located in Arapahoe County with nearby schools including Meadow Point Elementary School, Falcon Creek Middle School, and Grandview High School.
Ownership History
Date
Name
Owned For
Owner Type
Purchase Details
Closed on
Aug 28, 2003
Sold by
Perez Grace R
Bought by
Winkelman Gloria E
Current Estimated Value
Home Financials for this Owner
Home Financials are based on the most recent Mortgage that was taken out on this home.
Original Mortgage
$94,400
Outstanding Balance
$46,407
Interest Rate
5.87%
Mortgage Type
Purchase Money Mortgage
Purchase Details
Closed on
Feb 26, 1999
Sold by
Mcbride Kenneth Wayne
Bought by
Perez Grace R
Home Financials for this Owner
Home Financials are based on the most recent Mortgage that was taken out on this home.
Original Mortgage
$74,116
Interest Rate
6.8%
Purchase Details
Closed on
Dec 31, 1990
Sold by
Conversion Arapco
Bought by
Mcbride Kenneth Wayne
Purchase Details
Closed on
Jun 1, 1983
Bought by
Conversion Arapco
Create a Home Valuation Report for This Property
The Home Valuation Report is an in-depth analysis detailing your home's value as well as a comparison with similar homes in the area
Home Values in the Area
Average Home Value in this Area
Purchase History
| Date | Buyer | Sale Price | Title Company |
|---|---|---|---|
| Winkelman Gloria E | $118,000 | Land Title | |
| Perez Grace R | $75,900 | Stewart Title | |
| Mcbride Kenneth Wayne | -- | -- | |
| Conversion Arapco | -- | -- |
Source: Public Records
Mortgage History
| Date | Status | Borrower | Loan Amount |
|---|---|---|---|
| Open | Winkelman Gloria E | $54,000 | |
| Open | Winkelman Gloria E | $94,400 | |
| Previous Owner | Perez Grace R | $96,900 | |
| Previous Owner | Perez Grace R | $74,116 | |
| Closed | Perez Grace R | $2,000 |
Source: Public Records
Tax History Compared to Growth
Tax History
| Year | Tax Paid | Tax Assessment Tax Assessment Total Assessment is a certain percentage of the fair market value that is determined by local assessors to be the total taxable value of land and additions on the property. | Land | Improvement |
|---|---|---|---|---|
| 2024 | $1,090 | $15,752 | -- | -- |
| 2023 | $1,090 | $15,752 | $0 | $0 |
| 2022 | $1,094 | $15,103 | $0 | $0 |
| 2021 | $1,101 | $15,103 | $0 | $0 |
| 2020 | $1,022 | $14,235 | $0 | $0 |
| 2019 | $986 | $14,235 | $0 | $0 |
| 2018 | $740 | $10,044 | $0 | $0 |
| 2017 | $730 | $10,044 | $0 | $0 |
| 2016 | $486 | $6,265 | $0 | $0 |
| 2015 | $462 | $6,265 | $0 | $0 |
| 2014 | -- | $3,757 | $0 | $0 |
| 2013 | -- | $4,980 | $0 | $0 |
Source: Public Records
Map
Nearby Homes
- 17118 E Whitaker Dr Unit E
- 16941 E Chenango Ave Unit C
- 16901 E Chenango Ave Unit E
- 4856 S Quintero Cir
- 4833 S Pitkin Ct
- 5151 S Quintero St
- 5171 S Quintero St
- 17124 E Wagon Trail Pkwy
- 17470 E Whitaker Dr
- 16720 E Layton Ave
- 17422 E Progress Dr
- 5229 S Pagosa Way
- 4723 S Pagosa Way
- 16519 E Hialeah Dr
- 4922 S Rifle Ct
- 5157 S Sedalia Ct
- 16780 E Hialeah Ave
- 5138 S Sedalia Ct
- 17477 E Temple Dr
- 16755 E Union Ave
- 16996 E Piedmont Dr Unit A
- 16996 E Piedmont Dr Unit B
- 16996 E Piedmont Dr Unit C
- 16996 E Piedmont Dr Unit D
- 16996 E Piedmont Dr Unit E
- 16996 E Piedmont Dr Unit F
- 16986 E Piedmont Dr Unit A
- 16986 E Piedmont Dr Unit B
- 16986 E Piedmont Dr Unit C
- 16986 E Piedmont Dr Unit D
- 16986 E Piedmont Dr Unit E
- 16986 E Piedmont Dr Unit F
- 16986 E Piedmont Dr Unit G
- 16986 E Piedmont Dr Unit H
- 16994 E Whitaker Dr Unit A
- 16994 E Whitaker Dr Unit B
- 16994 E Whitaker Dr Unit C
- 16994 E Whitaker Dr Unit D
- 16994 E Whitaker Dr Unit E
- 16994 E Whitaker Dr Unit F