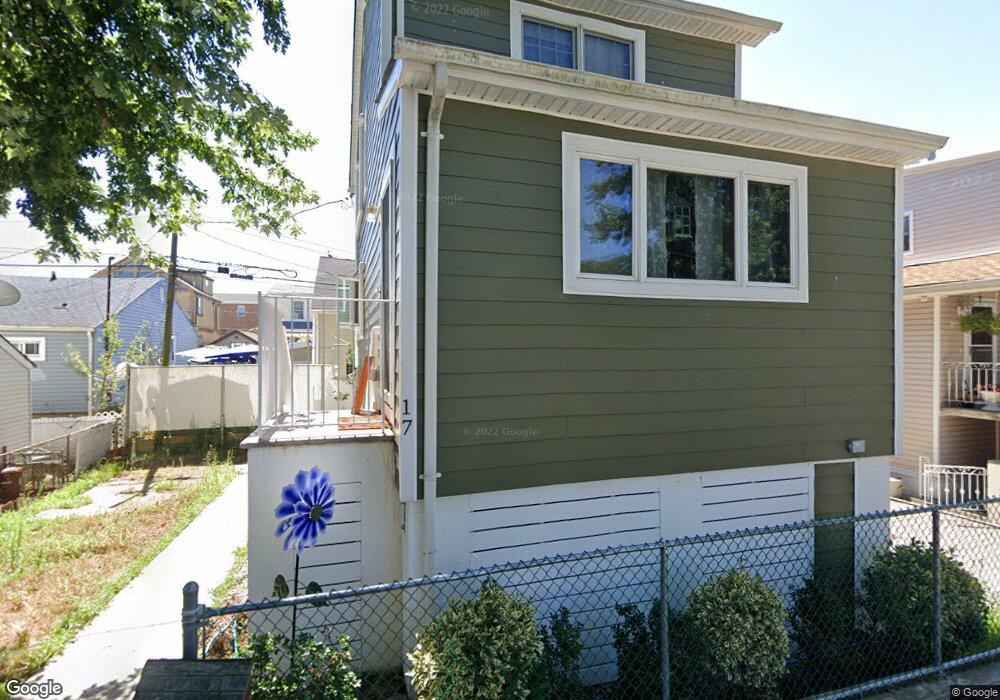
17 Abbey Ct Brooklyn, NY 11229
Gerritsen Beach NeighborhoodEstimated Value: $541,928 - $691,000
--
Bed
--
Bath
1,184
Sq Ft
$536/Sq Ft
Est. Value
About This Home
This home is located at 17 Abbey Ct, Brooklyn, NY 11229 and is currently estimated at $634,732, approximately $536 per square foot. 17 Abbey Ct is a home located in Kings County with nearby schools including P.S. 277 Gerritsen Beach, J.H.S. 278 Marine Park, and New Visions Charter High School for Advanced Math/ Science.
Ownership History
Date
Name
Owned For
Owner Type
Purchase Details
Closed on
Dec 11, 2003
Sold by
White Dennis L
Bought by
Morrissey Georgia
Current Estimated Value
Home Financials for this Owner
Home Financials are based on the most recent Mortgage that was taken out on this home.
Original Mortgage
$255,000
Interest Rate
5.67%
Mortgage Type
Purchase Money Mortgage
Create a Home Valuation Report for This Property
The Home Valuation Report is an in-depth analysis detailing your home's value as well as a comparison with similar homes in the area
Home Values in the Area
Average Home Value in this Area
Purchase History
| Date | Buyer | Sale Price | Title Company |
|---|---|---|---|
| Morrissey Georgia | $285,000 | -- |
Source: Public Records
Mortgage History
| Date | Status | Borrower | Loan Amount |
|---|---|---|---|
| Previous Owner | Morrissey Georgia | $255,000 |
Source: Public Records
Tax History Compared to Growth
Tax History
| Year | Tax Paid | Tax Assessment Tax Assessment Total Assessment is a certain percentage of the fair market value that is determined by local assessors to be the total taxable value of land and additions on the property. | Land | Improvement |
|---|---|---|---|---|
| 2025 | $4,873 | $31,680 | $6,780 | $24,900 |
| 2024 | $4,873 | $34,680 | $6,780 | $27,900 |
| 2023 | $4,753 | $33,000 | $6,780 | $26,220 |
| 2022 | $4,493 | $31,800 | $6,780 | $25,020 |
| 2021 | $4,562 | $33,240 | $6,780 | $26,460 |
| 2020 | $2,254 | $33,240 | $6,780 | $26,460 |
| 2019 | $3,529 | $29,640 | $6,780 | $22,860 |
| 2018 | $3,281 | $17,556 | $3,317 | $14,239 |
| 2017 | $3,133 | $16,838 | $4,314 | $12,524 |
| 2016 | $2,913 | $16,123 | $5,061 | $11,062 |
| 2015 | $1,696 | $16,020 | $7,500 | $8,520 |
| 2014 | $1,696 | $15,225 | $7,128 | $8,097 |
Source: Public Records
Map
Nearby Homes