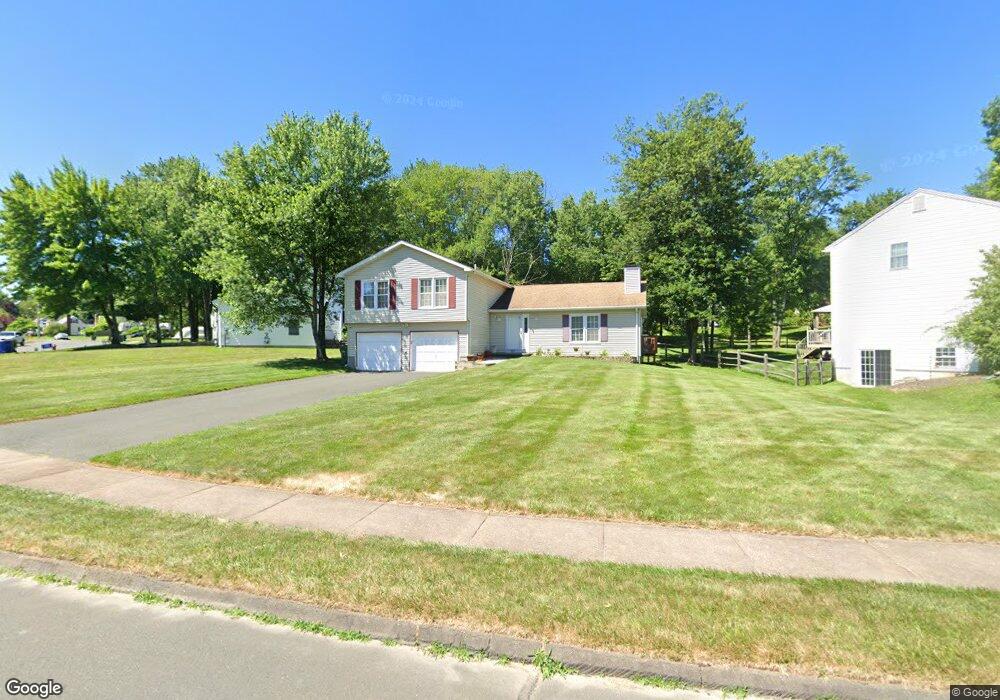
17 Amanda Cir Windsor, CT 06095
Estimated Value: $421,726 - $453,000
4
Beds
3
Baths
1,792
Sq Ft
$243/Sq Ft
Est. Value
About This Home
This home is located at 17 Amanda Cir, Windsor, CT 06095 and is currently estimated at $434,932, approximately $242 per square foot. 17 Amanda Cir is a home located in Hartford County with nearby schools including Oliver Ellsworth School, John F. Kennedy School, and Sage Park Middle School.
Ownership History
Date
Name
Owned For
Owner Type
Purchase Details
Closed on
Jan 5, 2017
Sold by
Gray Richard
Bought by
Gray Tamara
Current Estimated Value
Purchase Details
Closed on
Apr 3, 2008
Sold by
Greater Htfd Police Fc
Bought by
Gray Tamara and Gray Richard
Home Financials for this Owner
Home Financials are based on the most recent Mortgage that was taken out on this home.
Original Mortgage
$251,601
Interest Rate
6.06%
Mortgage Type
Purchase Money Mortgage
Purchase Details
Closed on
May 27, 1994
Sold by
Hirono David and Hirono Sandra
Bought by
Lawrence Edward and Lawrence Danette
Purchase Details
Closed on
May 4, 1989
Sold by
Coccomo John
Bought by
Liljedahl Mark
Create a Home Valuation Report for This Property
The Home Valuation Report is an in-depth analysis detailing your home's value as well as a comparison with similar homes in the area
Home Values in the Area
Average Home Value in this Area
Purchase History
| Date | Buyer | Sale Price | Title Company |
|---|---|---|---|
| Gray Tamara | -- | -- | |
| Gray Tamara | $255,550 | -- | |
| Lawrence Edward | $159,000 | -- | |
| Liljedahl Mark | $167,000 | -- |
Source: Public Records
Mortgage History
| Date | Status | Borrower | Loan Amount |
|---|---|---|---|
| Previous Owner | Liljedahl Mark | $248,742 | |
| Previous Owner | Liljedahl Mark | $251,601 | |
| Previous Owner | Liljedahl Mark | $17,558 |
Source: Public Records
Tax History
| Year | Tax Paid | Tax Assessment Tax Assessment Total Assessment is a certain percentage of the fair market value that is determined by local assessors to be the total taxable value of land and additions on the property. | Land | Improvement |
|---|---|---|---|---|
| 2025 | $7,215 | $253,610 | $62,650 | $190,960 |
| 2024 | $7,689 | $253,610 | $62,650 | $190,960 |
| 2023 | $5,838 | $173,740 | $49,280 | $124,460 |
| 2022 | $5,780 | $173,740 | $49,280 | $124,460 |
| 2021 | $5,780 | $173,740 | $49,280 | $124,460 |
| 2020 | $5,753 | $173,740 | $49,280 | $124,460 |
| 2019 | $5,626 | $173,740 | $49,280 | $124,460 |
| 2018 | $5,207 | $157,990 | $49,280 | $108,710 |
| 2017 | $5,127 | $157,990 | $49,280 | $108,710 |
| 2016 | $4,958 | $157,290 | $49,280 | $108,010 |
| 2015 | $4,863 | $157,290 | $49,280 | $108,010 |
| 2014 | $4,793 | $157,290 | $49,280 | $108,010 |
Source: Public Records
Map
Nearby Homes
Your Personal Tour Guide
Ask me questions while you tour the home.