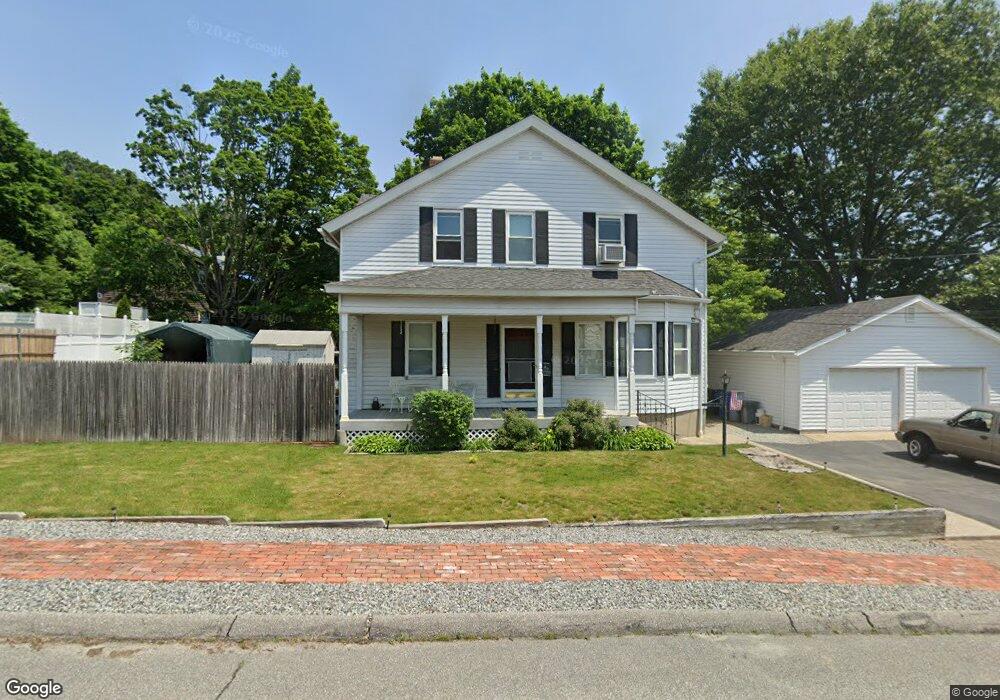
17 Asia St Cranston, RI 02920
Arlington NeighborhoodEstimated Value: $435,709 - $576,000
6
Beds
2
Baths
2,228
Sq Ft
$235/Sq Ft
Est. Value
About This Home
This home is located at 17 Asia St, Cranston, RI 02920 and is currently estimated at $523,177, approximately $234 per square foot. 17 Asia St is a home located in Providence County with nearby schools including Hugh B. Bain Middle School, Cranston High School East, and Achievement First Iluminar Mayoral Academy.
Ownership History
Date
Name
Owned For
Owner Type
Purchase Details
Closed on
Jul 24, 2018
Sold by
Taraksian Hagop and Taraksian Christine K
Bought by
Taraksian Hagop
Current Estimated Value
Purchase Details
Closed on
May 5, 2015
Sold by
Taraksian Hagop and Pisaturo Christine K
Bought by
Taraksian Hagop and Taraksian Christine K
Purchase Details
Closed on
Jan 25, 1990
Sold by
Scichilone Joseph J
Bought by
Taraksian Hagop
Home Financials for this Owner
Home Financials are based on the most recent Mortgage that was taken out on this home.
Original Mortgage
$121,850
Interest Rate
9.67%
Create a Home Valuation Report for This Property
The Home Valuation Report is an in-depth analysis detailing your home's value as well as a comparison with similar homes in the area
Home Values in the Area
Average Home Value in this Area
Purchase History
| Date | Buyer | Sale Price | Title Company |
|---|---|---|---|
| Taraksian Hagop | -- | -- | |
| Taraksian Hagop | -- | -- | |
| Taraksian Hagop | $128,500 | -- |
Source: Public Records
Mortgage History
| Date | Status | Borrower | Loan Amount |
|---|---|---|---|
| Previous Owner | Taraksian Hagop | $121,850 |
Source: Public Records
Tax History
| Year | Tax Paid | Tax Assessment Tax Assessment Total Assessment is a certain percentage of the fair market value that is determined by local assessors to be the total taxable value of land and additions on the property. | Land | Improvement |
|---|---|---|---|---|
| 2025 | $4,975 | $358,400 | $102,800 | $255,600 |
| 2024 | $4,878 | $358,400 | $102,800 | $255,600 |
| 2023 | $4,406 | $233,100 | $45,100 | $188,000 |
| 2022 | $4,315 | $233,100 | $45,100 | $188,000 |
| 2021 | $4,196 | $233,100 | $45,100 | $188,000 |
| 2020 | $3,838 | $184,800 | $35,500 | $149,300 |
| 2019 | $3,838 | $184,800 | $35,500 | $149,300 |
| 2018 | $3,750 | $184,800 | $35,500 | $149,300 |
| 2017 | $3,028 | $132,000 | $16,100 | $115,900 |
| 2016 | $2,963 | $132,000 | $16,100 | $115,900 |
| 2015 | $2,963 | $132,000 | $16,100 | $115,900 |
| 2014 | $2,818 | $123,400 | $16,100 | $107,300 |
Source: Public Records
Map
Nearby Homes
- 30 Lark Ave
- 19 Pavilion Ct
- 95 Elwyn St
- 79 Chestnut Hill Ave
- 51 Old Oak Ave
- 0 Princess Ave
- 1250 Cranston St
- 151 Chestnut Hill Ave
- 92 Old Oak Ave
- 74 Lake St Unit 76
- 69 Whipple Ave
- 18 Doane St
- 2 Gansett Ave
- 1303 Cranston St
- 60 Lowell St
- 33 Princess Ave
- 1354 Cranston St
- 443 Dyer Ave
- 761 Dyer Ave
- 0 Fiat Ave
Your Personal Tour Guide
Ask me questions while you tour the home.