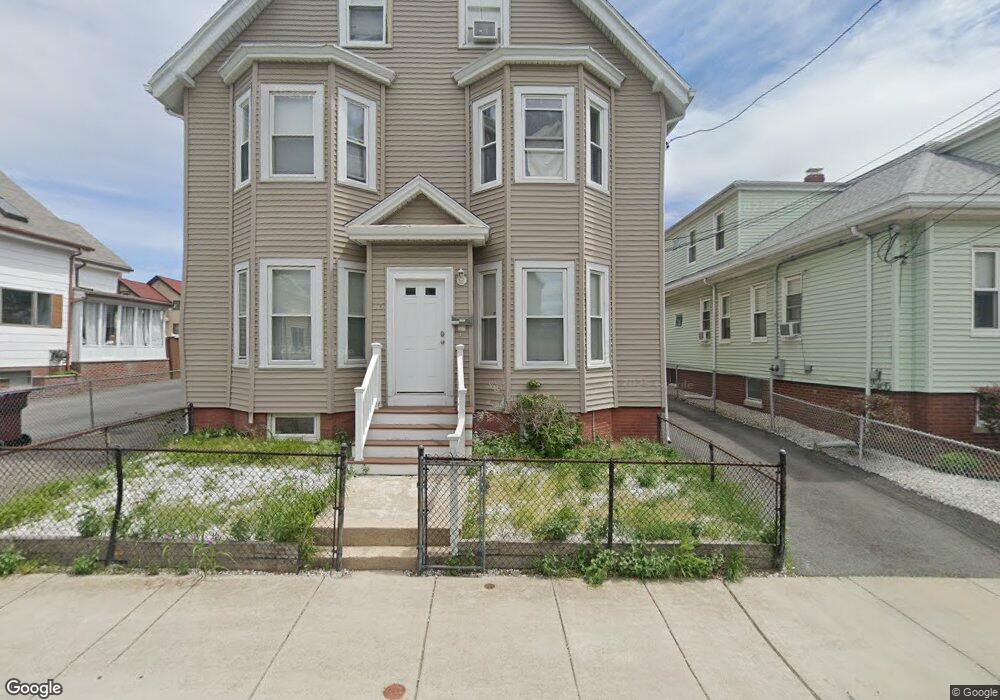
17 Autumn St Unit 3 Everett, MA 02149
Glendale NeighborhoodEstimated Value: $406,000 - $464,000
3
Beds
1
Bath
1,100
Sq Ft
$394/Sq Ft
Est. Value
About This Home
Luxury style 2 level 3 bedroom condo with open concept living area with stainless steel appliances, granite countertop, hardwood floors with unit dedicated washer/dryer.
Central air
1 off street parking
Everything updated and up to city code on very quiet street with easy access to route 16, boston, Medford, Cambridge and other cities.
Available for September 1 move in.
I'm asking first, last and security of $3000
No agent/broker fees
Ownership History
Date
Name
Owned For
Owner Type
Purchase Details
Closed on
Dec 30, 2014
Sold by
Banosian Shant
Bought by
Ugeh Ogo J
Current Estimated Value
Home Financials for this Owner
Home Financials are based on the most recent Mortgage that was taken out on this home.
Original Mortgage
$240,317
Outstanding Balance
$185,287
Interest Rate
4.02%
Mortgage Type
New Conventional
Estimated Equity
$248,185
Create a Home Valuation Report for This Property
The Home Valuation Report is an in-depth analysis detailing your home's value as well as a comparison with similar homes in the area
Home Values in the Area
Average Home Value in this Area
Purchase History
| Date | Buyer | Sale Price | Title Company |
|---|---|---|---|
| Ugeh Ogo J | $247,750 | -- |
Source: Public Records
Mortgage History
| Date | Status | Borrower | Loan Amount |
|---|---|---|---|
| Open | Ugeh Ogo J | $240,317 |
Source: Public Records
Property History
| Date | Event | Price | List to Sale | Price per Sq Ft |
|---|---|---|---|---|
| 12/23/2025 12/23/25 | Off Market | $3,400 | -- | -- |
| 12/16/2025 12/16/25 | For Rent | $3,400 | 0.0% | -- |
| 09/30/2025 09/30/25 | Off Market | $3,400 | -- | -- |
| 07/03/2025 07/03/25 | For Rent | $3,400 | -- | -- |
Tax History
| Year | Tax Paid | Tax Assessment Tax Assessment Total Assessment is a certain percentage of the fair market value that is determined by local assessors to be the total taxable value of land and additions on the property. | Land | Improvement |
|---|---|---|---|---|
| 2025 | $4,201 | $368,800 | $0 | $368,800 |
| 2024 | $3,903 | $340,600 | $0 | $340,600 |
| 2023 | $3,860 | $327,700 | $0 | $327,700 |
| 2022 | $3,347 | $323,100 | $0 | $323,100 |
| 2021 | $3,056 | $309,600 | $0 | $309,600 |
| 2020 | $3,294 | $309,600 | $0 | $309,600 |
| 2019 | $3,387 | $273,600 | $0 | $273,600 |
| 2018 | $3,475 | $252,200 | $0 | $252,200 |
| 2017 | $3,391 | $234,800 | $0 | $234,800 |
| 2016 | $3,319 | $229,700 | $0 | $229,700 |
| 2015 | $2,492 | $170,600 | $0 | $170,600 |
Source: Public Records
Map
Nearby Homes
- 105 Summer St
- 37 Argyle St
- 121 Cottage St
- 56 Mansfield St
- 110 Ferry St
- 11 Hampshire St
- 20 Ferry St Unit B
- 7 Hampshire St
- 20 Derne St
- 30 Chelsea St Unit 210
- 181 Chelsea St
- 18 Winter St
- 44-46 Cabot St
- 148 Florence St
- 238 Chelsea St
- 30 Woodlawn St
- 40 Baker Rd
- 114 Francis St
- 24 Corey St Unit 101
- 24 Corey St Unit 201
Your Personal Tour Guide
Ask me questions while you tour the home.