Estimated Value: $3,433,000 - $4,341,000
3
Beds
5
Baths
3,201
Sq Ft
$1,225/Sq Ft
Est. Value
About This Home
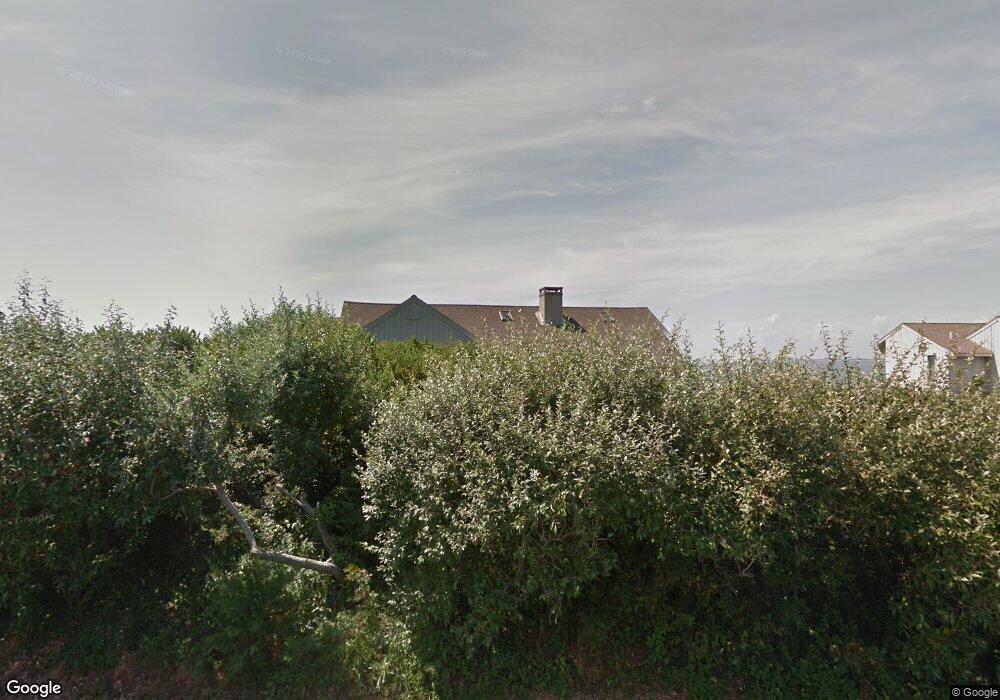
This home is located at 17 Avocet Rd, Truro, MA 02666 and is currently estimated at $3,922,591, approximately $1,225 per square foot. 17 Avocet Rd is a home located in Barnstable County.
Ownership History
Date
Name
Owned For
Owner Type
Purchase Details
Closed on
Sep 13, 2012
Sold by
Maffia Daniel and Maffia Mary
Bought by
E C Stanton T
Current Estimated Value
Purchase Details
Closed on
Nov 12, 1999
Sold by
Woelfel Joan Y
Bought by
Maffia Daniel and Maffia Mary
Home Financials for this Owner
Home Financials are based on the most recent Mortgage that was taken out on this home.
Original Mortgage
$200,000
Interest Rate
7.68%
Mortgage Type
Purchase Money Mortgage
Create a Home Valuation Report for This Property
The Home Valuation Report is an in-depth analysis detailing your home's value as well as a comparison with similar homes in the area
Home Values in the Area
Average Home Value in this Area
Purchase History
| Date | Buyer | Sale Price | Title Company |
|---|---|---|---|
| E C Stanton T | $1,500,000 | -- | |
| Maffia Daniel | $1,030,000 | -- |
Source: Public Records
Mortgage History
| Date | Status | Borrower | Loan Amount |
|---|---|---|---|
| Previous Owner | Maffia Daniel | $200,000 |
Source: Public Records
Tax History Compared to Growth
Tax History
| Year | Tax Paid | Tax Assessment Tax Assessment Total Assessment is a certain percentage of the fair market value that is determined by local assessors to be the total taxable value of land and additions on the property. | Land | Improvement |
|---|---|---|---|---|
| 2025 | $22,165 | $3,586,500 | $2,260,500 | $1,326,000 |
| 2024 | $19,299 | $3,221,800 | $1,958,400 | $1,263,400 |
| 2023 | $17,831 | $2,726,500 | $1,702,800 | $1,023,700 |
| 2022 | $17,157 | $2,219,500 | $1,467,800 | $751,700 |
| 2021 | $16,085 | $2,179,600 | $1,467,800 | $711,800 |
| 2020 | $15,890 | $2,167,800 | $1,453,100 | $714,700 |
| 2019 | $15,923 | $2,137,300 | $1,453,100 | $684,200 |
| 2018 | $16,105 | $2,185,200 | $1,556,900 | $628,300 |
| 2017 | $15,062 | $2,157,900 | $1,556,900 | $601,000 |
| 2016 | $14,482 | $2,139,100 | $1,541,800 | $597,300 |
| 2015 | $13,981 | $2,108,700 | $1,526,600 | $582,100 |
Source: Public Records
Map
Nearby Homes