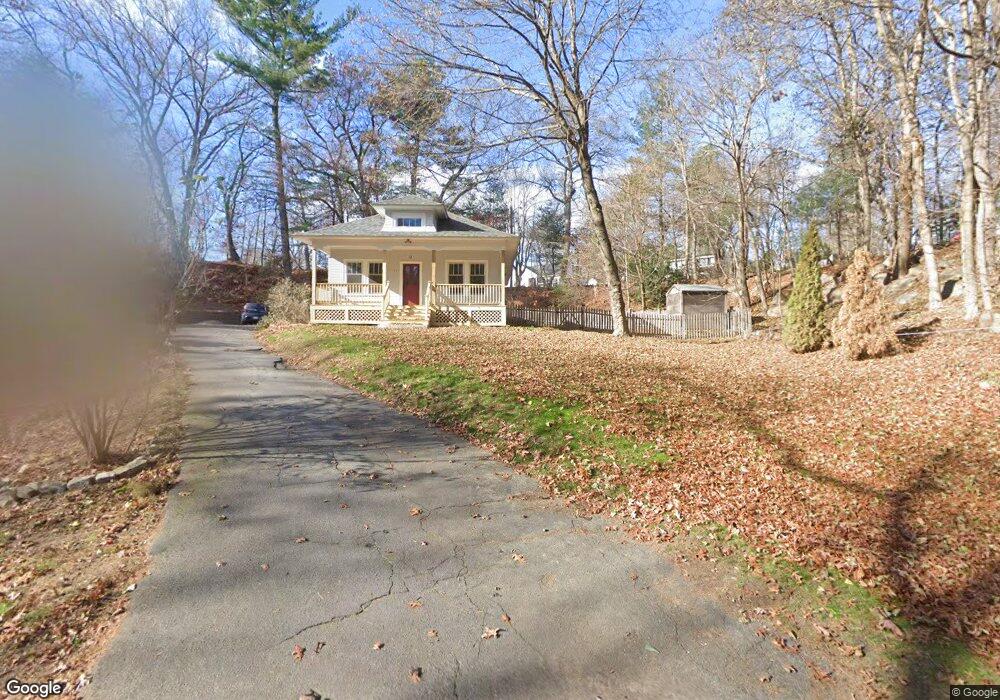
17 Ayer St Andover, MA 01810
Shawsheen Heights NeighborhoodEstimated Value: $611,000 - $755,000
3
Beds
1
Bath
1,092
Sq Ft
$611/Sq Ft
Est. Value
About This Home
This home is located at 17 Ayer St, Andover, MA 01810 and is currently estimated at $666,757, approximately $610 per square foot. 17 Ayer St is a home located in Essex County with nearby schools including West Elementary School, Andover West Middle School, and Andover High School.
Ownership History
Date
Name
Owned For
Owner Type
Purchase Details
Closed on
Nov 4, 2015
Sold by
Utzat Christopher D and Utzat Karissa
Bought by
Utzat Christopher D
Current Estimated Value
Home Financials for this Owner
Home Financials are based on the most recent Mortgage that was taken out on this home.
Original Mortgage
$265,000
Outstanding Balance
$207,927
Interest Rate
3.88%
Mortgage Type
New Conventional
Estimated Equity
$458,830
Purchase Details
Closed on
Apr 15, 2008
Sold by
Cosgrove Mary Beth
Bought by
Utzat Christopher D and Utzat Karissa
Home Financials for this Owner
Home Financials are based on the most recent Mortgage that was taken out on this home.
Original Mortgage
$294,500
Interest Rate
6.3%
Mortgage Type
Purchase Money Mortgage
Purchase Details
Closed on
Dec 14, 2007
Sold by
Cosgrove Mary Beth
Bought by
Cosgrove Mary Beth
Purchase Details
Closed on
Aug 28, 1996
Sold by
17 Ayer Street Rt
Bought by
Cosgrove Mary Beth
Purchase Details
Closed on
May 11, 1987
Sold by
Tatro John J
Bought by
Lai Fang S
Create a Home Valuation Report for This Property
The Home Valuation Report is an in-depth analysis detailing your home's value as well as a comparison with similar homes in the area
Home Values in the Area
Average Home Value in this Area
Purchase History
| Date | Buyer | Sale Price | Title Company |
|---|---|---|---|
| Utzat Christopher D | -- | -- | |
| Utzat Christopher D | -- | -- | |
| Utzat Christopher D | $310,000 | -- | |
| Utzat Christopher D | $310,000 | -- | |
| Cosgrove Mary Beth | -- | -- | |
| Cosgrove Mary Beth | -- | -- | |
| Cosgrove Mary Beth | $101,000 | -- | |
| Cosgrove Mary Beth | $101,000 | -- | |
| Lai Fang S | $105,000 | -- |
Source: Public Records
Mortgage History
| Date | Status | Borrower | Loan Amount |
|---|---|---|---|
| Open | Utzat Christopher D | $265,000 | |
| Closed | Lai Fang S | $265,000 | |
| Previous Owner | Lai Fang S | $288,790 | |
| Previous Owner | Utzat Christopher D | $294,500 |
Source: Public Records
Tax History
| Year | Tax Paid | Tax Assessment Tax Assessment Total Assessment is a certain percentage of the fair market value that is determined by local assessors to be the total taxable value of land and additions on the property. | Land | Improvement |
|---|---|---|---|---|
| 2024 | $8,793 | $682,700 | $455,800 | $226,900 |
| 2023 | $8,393 | $614,400 | $410,500 | $203,900 |
| 2022 | $7,865 | $538,700 | $363,400 | $175,300 |
| 2021 | $7,503 | $490,700 | $330,300 | $160,400 |
| 2020 | $7,191 | $479,100 | $322,300 | $156,800 |
| 2019 | $7,058 | $462,200 | $309,700 | $152,500 |
| 2018 | $6,753 | $431,800 | $292,100 | $139,700 |
| 2017 | $6,448 | $424,800 | $286,300 | $138,500 |
| 2016 | $6,296 | $424,800 | $286,300 | $138,500 |
| 2015 | $6,072 | $405,600 | $275,400 | $130,200 |
Source: Public Records
Map
Nearby Homes
- 10 Dartmouth Rd
- 34 Martingale Ln Unit 34
- 53 Martingale Ln
- 354 N Main St Unit 204
- 21 Clubview Dr Unit 21
- 116 Weare St
- 102 Weare St
- 42 York St
- 16 Balmoral St Unit 214
- 12B Stevens St
- 11 Swan Ln Unit 11
- 17 Carisbrooke St
- 25 Clubview Dr Unit 25
- 43 Gorham St
- 40 Chandler Cir
- 11 W Hawley St
- 28 Stirling St
- 24 Inman St Unit 4
- 34 Beaconsfield St
- 40C Washington Park Dr Unit 12
Your Personal Tour Guide
Ask me questions while you tour the home.