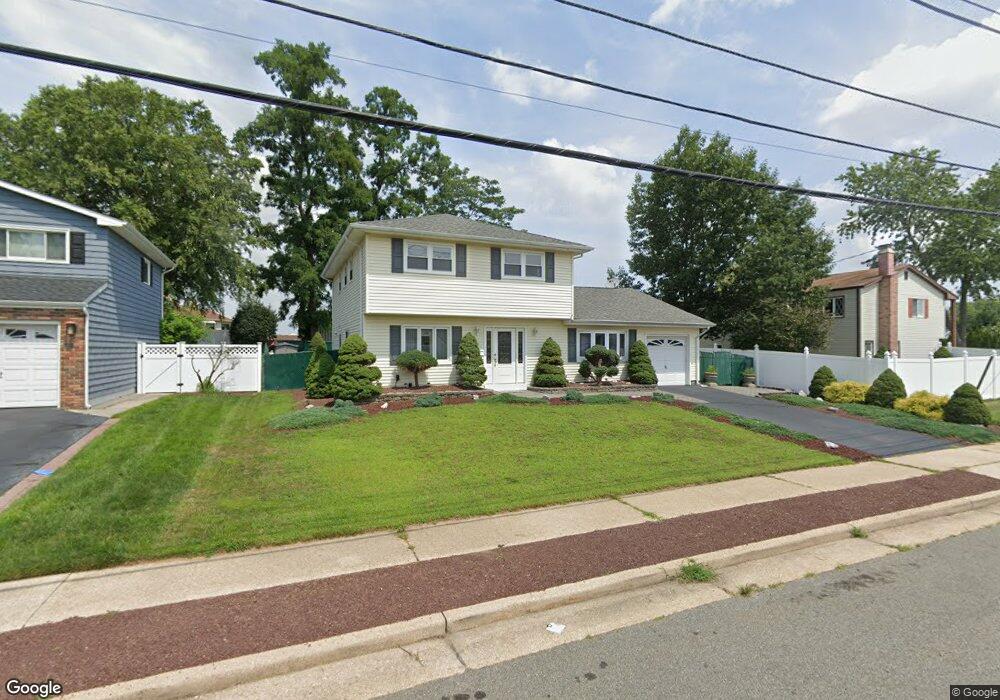
17 Belfast Ave Hazlet, NJ 07730
Estimated Value: $662,000 - $722,000
4
Beds
3
Baths
2,134
Sq Ft
$323/Sq Ft
Est. Value
About This Home
This home is located at 17 Belfast Ave, Hazlet, NJ 07730 and is currently estimated at $689,657, approximately $323 per square foot. 17 Belfast Ave is a home located in Monmouth County with nearby schools including Raritan High School, St Benedict School, and St. Joseph Elementary School.
Ownership History
Date
Name
Owned For
Owner Type
Purchase Details
Closed on
Feb 26, 2002
Sold by
Aversano Nancy
Bought by
Aversano John
Current Estimated Value
Home Financials for this Owner
Home Financials are based on the most recent Mortgage that was taken out on this home.
Original Mortgage
$140,000
Interest Rate
6.82%
Purchase Details
Closed on
Apr 1, 1996
Sold by
Verrone Adolfo
Bought by
Aversano John and Russo Nancy
Home Financials for this Owner
Home Financials are based on the most recent Mortgage that was taken out on this home.
Original Mortgage
$94,000
Interest Rate
7.31%
Create a Home Valuation Report for This Property
The Home Valuation Report is an in-depth analysis detailing your home's value as well as a comparison with similar homes in the area
Home Values in the Area
Average Home Value in this Area
Purchase History
| Date | Buyer | Sale Price | Title Company |
|---|---|---|---|
| Aversano John | $60,000 | -- | |
| Aversano John | $179,500 | -- |
Source: Public Records
Mortgage History
| Date | Status | Borrower | Loan Amount |
|---|---|---|---|
| Previous Owner | Aversano John | $140,000 | |
| Previous Owner | Aversano John | $94,000 |
Source: Public Records
Tax History Compared to Growth
Tax History
| Year | Tax Paid | Tax Assessment Tax Assessment Total Assessment is a certain percentage of the fair market value that is determined by local assessors to be the total taxable value of land and additions on the property. | Land | Improvement |
|---|---|---|---|---|
| 2025 | $11,478 | $608,800 | $375,000 | $233,800 |
| 2024 | $11,130 | $545,800 | $313,000 | $232,800 |
| 2023 | $11,130 | $520,800 | $290,000 | $230,800 |
| 2022 | $10,201 | $428,200 | $225,000 | $203,200 |
| 2021 | $10,201 | $397,700 | $217,000 | $180,700 |
| 2020 | $10,008 | $387,600 | $211,000 | $176,600 |
| 2019 | $9,721 | $370,600 | $195,000 | $175,600 |
| 2018 | $9,509 | $359,500 | $192,000 | $167,500 |
| 2017 | $9,239 | $349,300 | $187,000 | $162,300 |
| 2016 | $9,099 | $345,300 | $187,000 | $158,300 |
| 2015 | $8,927 | $339,700 | $186,000 | $153,700 |
| 2014 | $8,588 | $306,500 | $160,000 | $146,500 |
Source: Public Records
Map
Nearby Homes
- 9 Tralee Rd
- 570 Line Rd
- 30 Briscoe Terrace
- 101 Cresci Blvd
- 10 Deer St
- 2 Avondale Ln
- 70 Northland Ln
- 3 Avondale Ln
- 40 North Cir
- 46 Parkview Dr
- 672 N Beers St
- 627 Beers St
- 7 Kaylen Place
- 160 Village Green Way
- 13 Ivy Hill Dr
- 16 Moak Dr
- 557 Lloyd Rd Unit B
- 642 Holmdel Rd
- 118 Village Green Way
- 47 Village Green Way