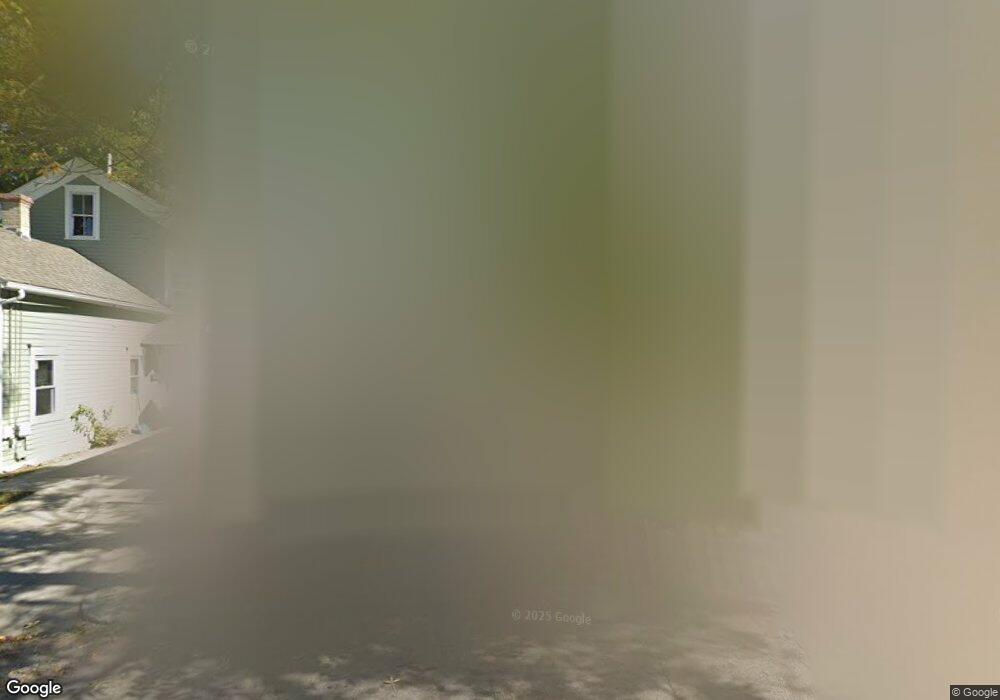
17 Berlin St Providence, RI 02908
Valley NeighborhoodEstimated Value: $377,773 - $475,000
3
Beds
2
Baths
1,436
Sq Ft
$313/Sq Ft
Est. Value
About This Home
This home is located at 17 Berlin St, Providence, RI 02908 and is currently estimated at $449,443, approximately $312 per square foot. 17 Berlin St is a home located in Providence County with nearby schools including Blessed Sacrament School, Mount Pleasant Academy, and La Salle Academy.
Ownership History
Date
Name
Owned For
Owner Type
Purchase Details
Closed on
May 27, 2009
Sold by
Gmac Mortgage Llc
Bought by
Cortez Ana F
Current Estimated Value
Purchase Details
Closed on
Mar 24, 2008
Sold by
Olivo Ramon and Olivo Roger
Bought by
Gmac Mortgage Llc
Purchase Details
Closed on
Nov 8, 2005
Sold by
Cobble Hill Dev Llc
Bought by
Olivo Roger
Home Financials for this Owner
Home Financials are based on the most recent Mortgage that was taken out on this home.
Original Mortgage
$42,980
Interest Rate
5.85%
Mortgage Type
Purchase Money Mortgage
Create a Home Valuation Report for This Property
The Home Valuation Report is an in-depth analysis detailing your home's value as well as a comparison with similar homes in the area
Home Values in the Area
Average Home Value in this Area
Purchase History
| Date | Buyer | Sale Price | Title Company |
|---|---|---|---|
| Cortez Ana F | $33,500 | -- | |
| Gmac Mortgage Llc | $114,750 | -- | |
| Olivo Roger | $53,500 | -- | |
| Olivo Roger | $53,500 | -- | |
| Olivo Roger | $107,500 | -- |
Source: Public Records
Mortgage History
| Date | Status | Borrower | Loan Amount |
|---|---|---|---|
| Previous Owner | Olivo Roger | $270,250 | |
| Previous Owner | Olivo Roger | $42,980 |
Source: Public Records
Tax History
| Year | Tax Paid | Tax Assessment Tax Assessment Total Assessment is a certain percentage of the fair market value that is determined by local assessors to be the total taxable value of land and additions on the property. | Land | Improvement |
|---|---|---|---|---|
| 2025 | $2,654 | $351,500 | $110,900 | $240,600 |
| 2024 | $4,389 | $239,200 | $67,300 | $171,900 |
| 2023 | $4,389 | $239,200 | $67,300 | $171,900 |
| 2022 | $4,258 | $239,200 | $67,300 | $171,900 |
| 2021 | $3,522 | $143,400 | $45,300 | $98,100 |
| 2020 | $3,522 | $143,400 | $45,300 | $98,100 |
| 2019 | $3,522 | $143,400 | $45,300 | $98,100 |
| 2018 | $3,170 | $99,200 | $35,700 | $63,500 |
| 2017 | $3,170 | $99,200 | $35,700 | $63,500 |
| 2016 | $3,170 | $99,200 | $35,700 | $63,500 |
| 2015 | $3,191 | $96,400 | $43,900 | $52,500 |
| 2014 | $3,254 | $96,400 | $43,900 | $52,500 |
| 2013 | $3,254 | $96,400 | $43,900 | $52,500 |
Source: Public Records
Map
Nearby Homes
Your Personal Tour Guide
Ask me questions while you tour the home.