17 Bristol Ct Little Rock, AR 72211
Hillsborough NeighborhoodEstimated Value: $447,208 - $468,000
3
Beds
3
Baths
2,900
Sq Ft
$157/Sq Ft
Est. Value
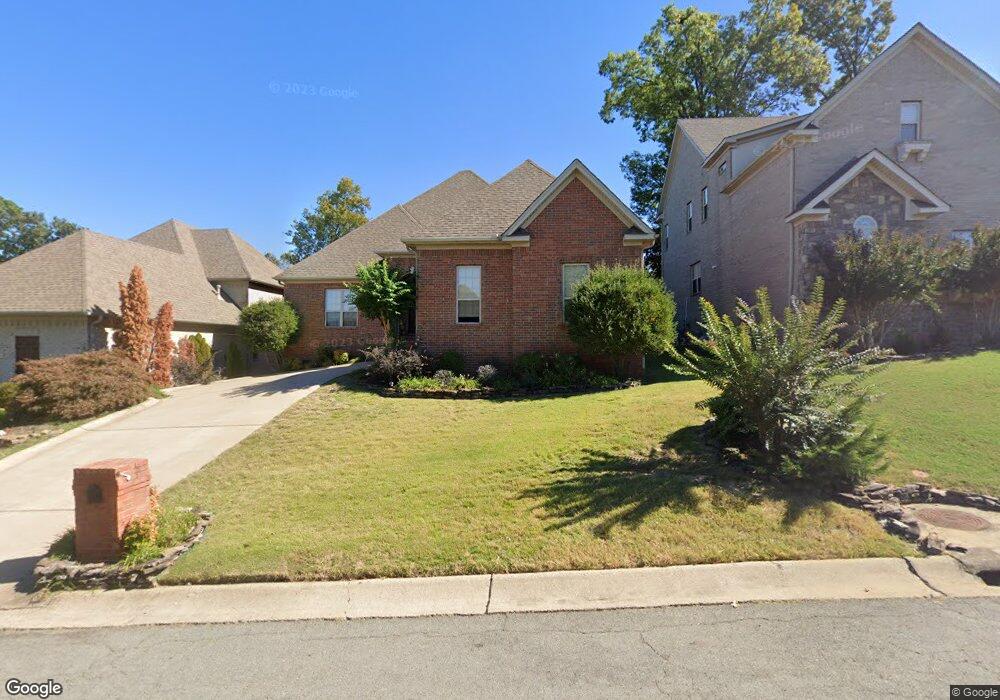
About This Home
This home is located at 17 Bristol Ct, Little Rock, AR 72211 and is currently estimated at $456,052, approximately $157 per square foot. 17 Bristol Ct is a home located in Pulaski County with nearby schools including Chenal Elementary School, Joe T. Robinson Middle School, and Joe T. Robinson High School.
Ownership History
Date
Name
Owned For
Owner Type
Purchase Details
Closed on
Jun 19, 2025
Sold by
Soultanova Izoumroud O
Bought by
Soultanova Izoumroud O and Bagandov Osman
Current Estimated Value
Purchase Details
Closed on
May 27, 2010
Sold by
Kell Danny W and Kell Pamela L
Bought by
Soultanova Izoumroud
Home Financials for this Owner
Home Financials are based on the most recent Mortgage that was taken out on this home.
Original Mortgage
$310,000
Interest Rate
6.12%
Mortgage Type
New Conventional
Purchase Details
Closed on
Aug 31, 2006
Sold by
Emw Construction Inc
Bought by
Kell Danny W and Kell Pamela L
Purchase Details
Closed on
Jul 30, 2004
Sold by
Winrock Development Co
Bought by
Emw Construction Inc
Home Financials for this Owner
Home Financials are based on the most recent Mortgage that was taken out on this home.
Original Mortgage
$252,800
Interest Rate
6.02%
Mortgage Type
Construction
Create a Home Valuation Report for This Property
The Home Valuation Report is an in-depth analysis detailing your home's value as well as a comparison with similar homes in the area
Home Values in the Area
Average Home Value in this Area
Purchase History
| Date | Buyer | Sale Price | Title Company |
|---|---|---|---|
| Soultanova Izoumroud O | -- | None Listed On Document | |
| Soultanova Izoumroud | $310,000 | First National Title Company | |
| Kell Danny W | $315,000 | First National Title Company | |
| Emw Construction Inc | $52,000 | Lenders Title Co |
Source: Public Records
Mortgage History
| Date | Status | Borrower | Loan Amount |
|---|---|---|---|
| Previous Owner | Soultanova Izoumroud | $310,000 | |
| Previous Owner | Emw Construction Inc | $252,800 |
Source: Public Records
Tax History Compared to Growth
Tax History
| Year | Tax Paid | Tax Assessment Tax Assessment Total Assessment is a certain percentage of the fair market value that is determined by local assessors to be the total taxable value of land and additions on the property. | Land | Improvement |
|---|---|---|---|---|
| 2025 | $4,953 | $77,029 | $9,000 | $68,029 |
| 2024 | $4,632 | $77,029 | $9,000 | $68,029 |
| 2023 | $4,632 | $77,029 | $9,000 | $68,029 |
| 2022 | $4,421 | $77,029 | $9,000 | $68,029 |
| 2021 | $4,244 | $65,490 | $7,700 | $57,790 |
| 2020 | $3,836 | $65,490 | $7,700 | $57,790 |
| 2019 | $3,836 | $65,490 | $7,700 | $57,790 |
| 2018 | $3,861 | $65,490 | $7,700 | $57,790 |
| 2017 | $3,861 | $65,490 | $7,700 | $57,790 |
| 2016 | $4,309 | $67,010 | $11,450 | $55,560 |
| 2015 | $4,342 | $67,010 | $11,450 | $55,560 |
| 2014 | $4,342 | $67,009 | $11,450 | $55,559 |
Source: Public Records
Map
Nearby Homes
- 15 Bristol Ct
- 131 Wellington Plantation Ln
- 44 Bristol Ct
- 122 Wellington Plantation Ln
- 1919 Wellington Village Rd
- 112 Blackburn Dr
- 23 Glasgow Ct
- 2001 Wellington Plantation Dr
- 75 Wellington Colony Dr
- 36 Glasgow Ct
- 44 Longwell Loop
- 22 Jacob Place
- 168 Blackburn Dr
- 1606 Wetherborne Dr
- 104 Bear Den Ct
- 2106 Wellington Woods Dr
- 14020 Belle Pointe Dr
- 3 Haywood Ct
- 6 Haywood Ct
- 88 Falstone Dr
- 19 Bristol Ct
- 125 Wellington Plantation Ln
- 21 Bristol Ct
- 11 Bristol Ct
- 127 Wellington Plantation Ln
- 123 Wellington Plantation Ln
- 18 Bristol Ct
- 16 Bristol Ct
- 20 Bristol Ct
- 9 Bristol Ct
- 14 Bristol Ct
- 129 Wellington Plantation Ln
- 26 Bristol Ct
- 12 Bristol Ct
- 7 Bristol Ct
- 121 Wellington Plantation Ln
- 0 Wellington Plantation Ln Unit 16035072
- 0 Wellington Plantation Ln Unit 17009172
- 0 Wellington Plantation Ln Unit 17028674
- 0 Wellington Plantation Ln Unit 17030633