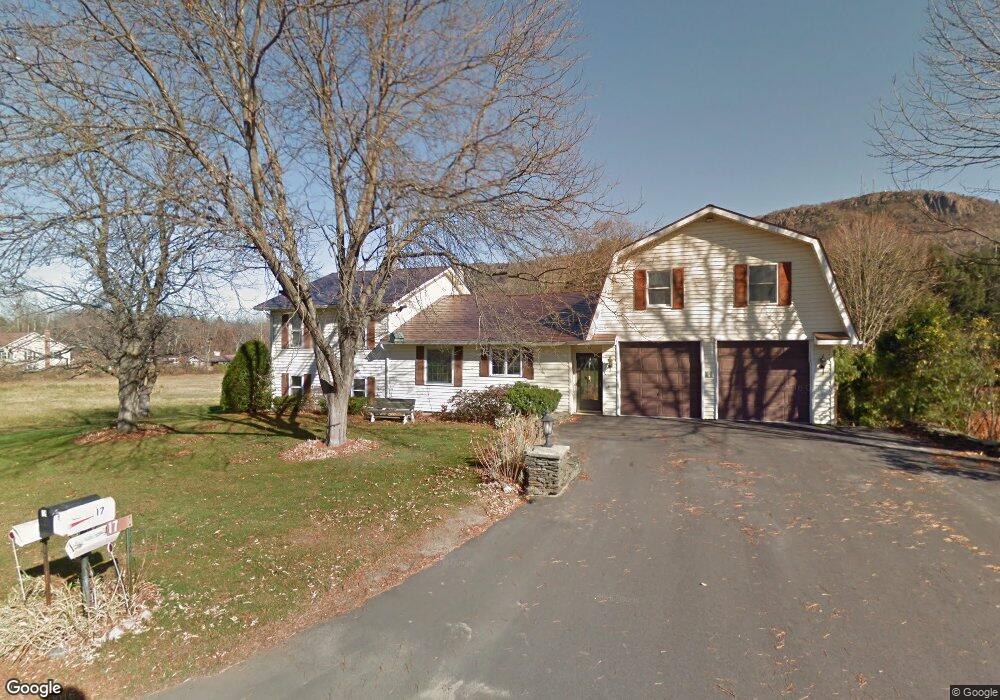
17 Brook St Easthampton, MA 01027
Estimated Value: $551,000 - $666,000
3
Beds
3
Baths
2,886
Sq Ft
$219/Sq Ft
Est. Value
About This Home
This home is located at 17 Brook St, Easthampton, MA 01027 and is currently estimated at $630,738, approximately $218 per square foot. 17 Brook St is a home located in Hampshire County with nearby schools including Easthampton High School, Tri-County Schools, and New England Adolescent Research Institute.
Ownership History
Date
Name
Owned For
Owner Type
Purchase Details
Closed on
Oct 10, 2019
Sold by
Davis Allen G and Nickerson Nancy
Bought by
Nickerson & Davis 2019 Irt
Current Estimated Value
Purchase Details
Closed on
Jan 21, 1997
Sold by
Leveille Genevieve G and Leveille Thomas F
Bought by
Davis Allen G and Nickerson Nancy
Home Financials for this Owner
Home Financials are based on the most recent Mortgage that was taken out on this home.
Original Mortgage
$110,000
Interest Rate
7.36%
Mortgage Type
Purchase Money Mortgage
Create a Home Valuation Report for This Property
The Home Valuation Report is an in-depth analysis detailing your home's value as well as a comparison with similar homes in the area
Home Values in the Area
Average Home Value in this Area
Purchase History
| Date | Buyer | Sale Price | Title Company |
|---|---|---|---|
| Nickerson & Davis 2019 Irt | -- | -- | |
| Davis Allen G | $149,500 | -- |
Source: Public Records
Mortgage History
| Date | Status | Borrower | Loan Amount |
|---|---|---|---|
| Previous Owner | Davis Allen G | $110,000 |
Source: Public Records
Tax History
| Year | Tax Paid | Tax Assessment Tax Assessment Total Assessment is a certain percentage of the fair market value that is determined by local assessors to be the total taxable value of land and additions on the property. | Land | Improvement |
|---|---|---|---|---|
| 2025 | $7,976 | $583,500 | $134,200 | $449,300 |
| 2024 | $7,705 | $568,200 | $130,300 | $437,900 |
| 2023 | $5,750 | $392,500 | $103,300 | $289,200 |
| 2022 | $6,488 | $392,500 | $103,300 | $289,200 |
| 2021 | $7,135 | $406,800 | $103,300 | $303,500 |
| 2020 | $6,971 | $392,500 | $103,300 | $289,200 |
| 2019 | $5,328 | $344,600 | $103,300 | $241,300 |
| 2018 | $5,093 | $318,300 | $97,200 | $221,100 |
| 2017 | $4,975 | $306,900 | $93,400 | $213,500 |
| 2016 | $4,785 | $306,900 | $93,400 | $213,500 |
| 2015 | $4,650 | $306,900 | $93,400 | $213,500 |
Source: Public Records
Map
Nearby Homes
Your Personal Tour Guide
Ask me questions while you tour the home.