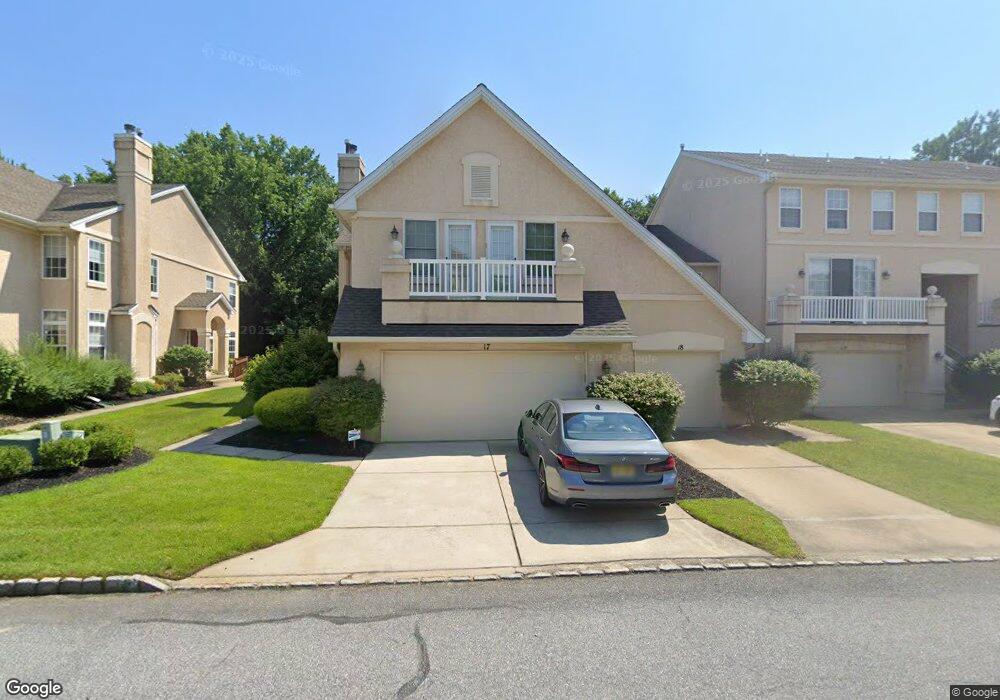
17 Buckingham Place Cherry Hill, NJ 08003
Estimated Value: $538,000 - $735,107
3
Beds
3
Baths
2,276
Sq Ft
$290/Sq Ft
Est. Value
About This Home
This home is located at 17 Buckingham Place, Cherry Hill, NJ 08003 and is currently estimated at $660,027, approximately $289 per square foot. 17 Buckingham Place is a home located in Camden County with nearby schools including James H. Johnson School, Henry C. Beck Middle School, and Cherry Hill High-East High School.
Ownership History
Date
Name
Owned For
Owner Type
Purchase Details
Closed on
Jul 19, 2005
Sold by
Winslow Hovbros
Bought by
Gibson Wilmot J and Gibson Erin D
Current Estimated Value
Home Financials for this Owner
Home Financials are based on the most recent Mortgage that was taken out on this home.
Original Mortgage
$354,753
Outstanding Balance
$184,347
Interest Rate
5.59%
Estimated Equity
$475,680
Purchase Details
Closed on
Jul 1, 2005
Sold by
Im Johnny J
Bought by
Levy Marlene Lamont
Home Financials for this Owner
Home Financials are based on the most recent Mortgage that was taken out on this home.
Original Mortgage
$354,753
Outstanding Balance
$184,347
Interest Rate
5.59%
Estimated Equity
$475,680
Purchase Details
Closed on
Jan 18, 2002
Sold by
Doloff Leonard H
Bought by
Im Johnny J
Home Financials for this Owner
Home Financials are based on the most recent Mortgage that was taken out on this home.
Original Mortgage
$155,000
Interest Rate
7.08%
Create a Home Valuation Report for This Property
The Home Valuation Report is an in-depth analysis detailing your home's value as well as a comparison with similar homes in the area
Home Values in the Area
Average Home Value in this Area
Purchase History
| Date | Buyer | Sale Price | Title Company |
|---|---|---|---|
| Gibson Wilmot J | $473,004 | -- | |
| Levy Marlene Lamont | $399,900 | -- | |
| Im Johnny J | $279,900 | -- |
Source: Public Records
Mortgage History
| Date | Status | Borrower | Loan Amount |
|---|---|---|---|
| Open | Gibson Wilmot J | $354,753 | |
| Previous Owner | Im Johnny J | $155,000 |
Source: Public Records
Tax History Compared to Growth
Tax History
| Year | Tax Paid | Tax Assessment Tax Assessment Total Assessment is a certain percentage of the fair market value that is determined by local assessors to be the total taxable value of land and additions on the property. | Land | Improvement |
|---|---|---|---|---|
| 2025 | $13,560 | $304,100 | $60,000 | $244,100 |
| 2024 | $12,778 | $304,100 | $60,000 | $244,100 |
| 2023 | $12,778 | $304,100 | $60,000 | $244,100 |
| 2022 | $12,426 | $304,100 | $60,000 | $244,100 |
| 2021 | $12,465 | $304,100 | $60,000 | $244,100 |
| 2020 | $12,313 | $304,100 | $60,000 | $244,100 |
| 2019 | $12,307 | $304,100 | $60,000 | $244,100 |
| 2018 | $12,273 | $304,100 | $60,000 | $244,100 |
| 2017 | $12,106 | $304,100 | $60,000 | $244,100 |
| 2016 | $11,945 | $304,100 | $60,000 | $244,100 |
| 2015 | $11,757 | $304,100 | $60,000 | $244,100 |
| 2014 | $11,626 | $304,100 | $60,000 | $244,100 |
Source: Public Records
Map
Nearby Homes
- 117 Lucerne Blvd
- 1222 Sequoia Rd
- 1109 Winding Dr
- 2 Collage Ct
- 314 Covered Bridge Rd
- 7 Cameo Ct
- 725 Society Hill Blvd
- 119 W Riding Rd
- 1216 Wyndmoor Rd
- 307 Society Hill Blvd
- 1217 Forge Rd
- 1003 Society Hill Blvd
- 1037 Society Hill Blvd
- 102 Lane of Trees
- 110 Partree Rd
- 102 Partree Rd
- 1314 Kresson Rd
- 1227 Cotswold Ln
- 1324 Charleston Rd
- 505 Fern Ave
- 18 Buckingham Place
- 16 Buckingham Place
- 20 Buckingham Place
- 15 Buckingham Place Unit C0015
- 21 Buckingham Place
- 14 Buckingham Place
- 22 Buckingham Place
- 13 Buckingham Place
- 67 Buckingham Place
- 68 Buckingham Place
- 66 Buckingham Place
- 12 Buckingham Place
- 69 Buckingham Place
- 65 Buckingham Place
- 70 Buckingham Place
- 64 Buckingham Place
- 11 Buckingham Place
- 63 Buckingham Place
- 71 Buckingham Place
- 72 Buckingham Place