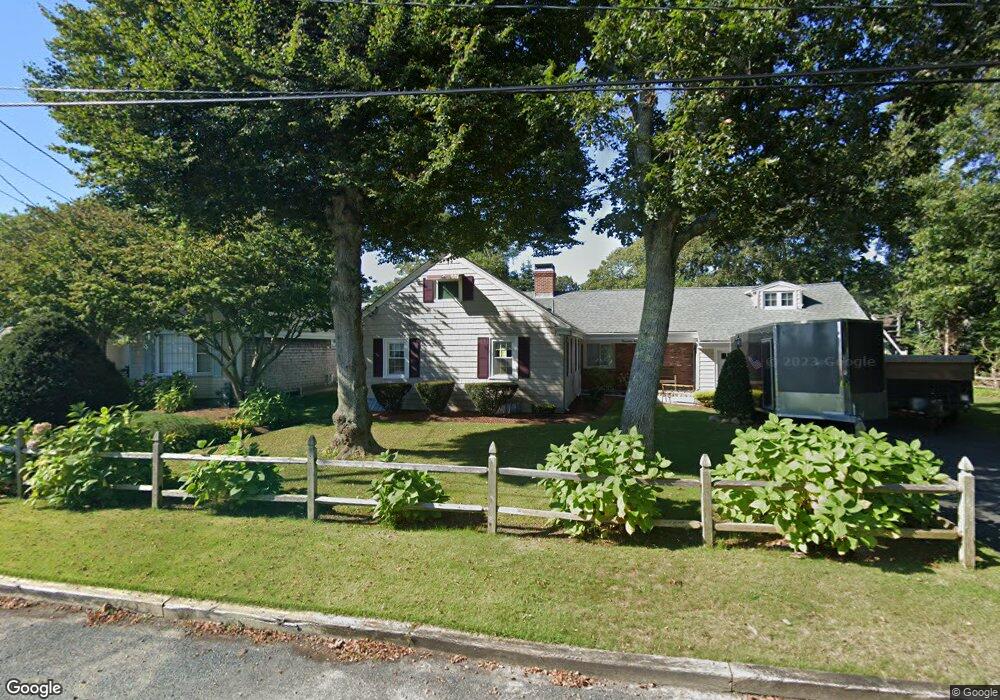
17 Burch Rd Unit 17A South Yarmouth, MA 02664
Estimated Value: $554,000 - $894,920
3
Beds
3
Baths
1,379
Sq Ft
$521/Sq Ft
Est. Value
About This Home
This home is located at 17 Burch Rd Unit 17A, South Yarmouth, MA 02664 and is currently estimated at $718,980, approximately $521 per square foot. 17 Burch Rd Unit 17A is a home located in Barnstable County with nearby schools including Dennis-Yarmouth Regional High School and St. Pius X. School.
Ownership History
Date
Name
Owned For
Owner Type
Purchase Details
Closed on
Apr 4, 2017
Sold by
Vollemans Richard and Vollemans Marie
Bought by
Vollemans Marie and Vollemans Richard
Current Estimated Value
Purchase Details
Closed on
Mar 26, 1993
Sold by
Lachapelle Anthony D and Lachapelle Carmine D
Bought by
Vallemans Richard and Vallemans Marie
Home Financials for this Owner
Home Financials are based on the most recent Mortgage that was taken out on this home.
Original Mortgage
$99,000
Interest Rate
7.73%
Mortgage Type
Purchase Money Mortgage
Create a Home Valuation Report for This Property
The Home Valuation Report is an in-depth analysis detailing your home's value as well as a comparison with similar homes in the area
Home Values in the Area
Average Home Value in this Area
Purchase History
| Date | Buyer | Sale Price | Title Company |
|---|---|---|---|
| Vollemans Marie | -- | -- | |
| Vallemans Richard | $139,000 | -- | |
| Vollemans Richard | $139,000 | -- |
Source: Public Records
Mortgage History
| Date | Status | Borrower | Loan Amount |
|---|---|---|---|
| Previous Owner | Vollemans Richard | $99,000 |
Source: Public Records
Tax History Compared to Growth
Tax History
| Year | Tax Paid | Tax Assessment Tax Assessment Total Assessment is a certain percentage of the fair market value that is determined by local assessors to be the total taxable value of land and additions on the property. | Land | Improvement |
|---|---|---|---|---|
| 2025 | $5,286 | $746,600 | $444,100 | $302,500 |
| 2024 | $4,669 | $632,700 | $386,100 | $246,600 |
| 2023 | $4,555 | $561,700 | $315,200 | $246,500 |
| 2022 | $4,946 | $538,800 | $283,000 | $255,800 |
| 2021 | $5,062 | $529,500 | $265,900 | $263,600 |
| 2020 | $4,197 | $419,700 | $254,100 | $165,600 |
| 2019 | $4,082 | $404,200 | $254,100 | $150,100 |
| 2018 | $4,029 | $391,500 | $241,400 | $150,100 |
| 2017 | $3,803 | $379,500 | $241,400 | $138,100 |
| 2016 | $3,787 | $379,500 | $241,400 | $138,100 |
| 2015 | $3,810 | $379,500 | $241,400 | $138,100 |
Source: Public Records
Map
Nearby Homes