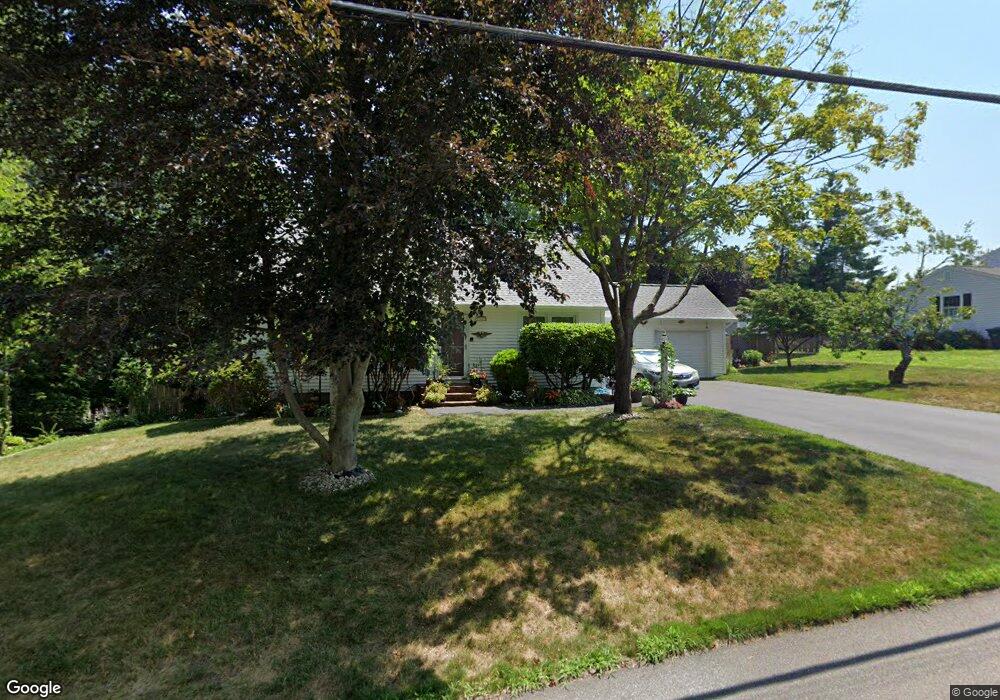
17 Burgess St Nashua, NH 03064
North End Nashua NeighborhoodEstimated Value: $499,000 - $575,000
3
Beds
2
Baths
1,501
Sq Ft
$359/Sq Ft
Est. Value
About This Home
This home is located at 17 Burgess St, Nashua, NH 03064 and is currently estimated at $539,046, approximately $359 per square foot. 17 Burgess St is a home located in Hillsborough County with nearby schools including Charlotte Ave Elementary School, Pennichuck Middle School, and Nashua High School North.
Ownership History
Date
Name
Owned For
Owner Type
Purchase Details
Closed on
Oct 25, 2017
Sold by
Collins Paul M and Iwicki Linda R
Bought by
Collins Iwicki Ret and Collins
Current Estimated Value
Purchase Details
Closed on
Jul 5, 2005
Sold by
Woodward Daniel R and Woodward Shannon J
Bought by
Sabin Ross M and Sabin Tracey
Home Financials for this Owner
Home Financials are based on the most recent Mortgage that was taken out on this home.
Original Mortgage
$293,000
Interest Rate
5.73%
Mortgage Type
Purchase Money Mortgage
Purchase Details
Closed on
Aug 16, 2001
Sold by
Olsen Kristin E
Bought by
Collins Paul and Collins Sujaree
Home Financials for this Owner
Home Financials are based on the most recent Mortgage that was taken out on this home.
Original Mortgage
$157,600
Interest Rate
7.16%
Mortgage Type
Purchase Money Mortgage
Purchase Details
Closed on
Jul 11, 2000
Sold by
R J Moreau Co Inc
Bought by
Woodward Daniel R and Woodward Shannon J
Create a Home Valuation Report for This Property
The Home Valuation Report is an in-depth analysis detailing your home's value as well as a comparison with similar homes in the area
Home Values in the Area
Average Home Value in this Area
Purchase History
| Date | Buyer | Sale Price | Title Company |
|---|---|---|---|
| Collins Iwicki Ret | -- | -- | |
| Sabin Ross M | $367,000 | -- | |
| Collins Paul | $197,000 | -- | |
| Woodward Daniel R | $210,400 | -- |
Source: Public Records
Mortgage History
| Date | Status | Borrower | Loan Amount |
|---|---|---|---|
| Previous Owner | Woodward Daniel R | $293,000 | |
| Previous Owner | Woodward Daniel R | $157,600 |
Source: Public Records
Tax History Compared to Growth
Tax History
| Year | Tax Paid | Tax Assessment Tax Assessment Total Assessment is a certain percentage of the fair market value that is determined by local assessors to be the total taxable value of land and additions on the property. | Land | Improvement |
|---|---|---|---|---|
| 2024 | $7,702 | $484,400 | $160,400 | $324,000 |
| 2023 | $7,228 | $396,500 | $128,300 | $268,200 |
| 2022 | $7,165 | $396,500 | $128,300 | $268,200 |
| 2021 | $6,170 | $265,700 | $85,500 | $180,200 |
| 2020 | $5,994 | $265,100 | $85,500 | $179,600 |
| 2019 | $5,769 | $265,100 | $85,500 | $179,600 |
| 2018 | $5,623 | $265,100 | $85,500 | $179,600 |
| 2017 | $5,563 | $215,700 | $73,200 | $142,500 |
| 2016 | $5,408 | $215,700 | $73,200 | $142,500 |
| 2015 | $5,291 | $215,700 | $73,200 | $142,500 |
| 2014 | $5,188 | $215,700 | $73,200 | $142,500 |
Source: Public Records
Map
Nearby Homes
- 30 Burgess St
- 33 Ferry Rd
- 17 Danbury Rd
- 31 Ashland St
- 3 Wright Rd
- 11 Amherst Terrace
- 44 Broad St
- 31 Juliana Ave
- 31 Juliana Ave Unit 4
- 3 Opal Way Unit 3
- 1 Opal Way Unit 1
- 2 Opal Way Unit 2
- 12 Juliana Ave Unit 14
- 11 Juliana Ave Unit 52
- 4 Reservoir St
- 19 Bartlett Ave
- 74 Profile Cir
- 0 Baldwin St
- 123 Cannongate III
- 36-38 Courtland St
- 15 Burgess St
- 16 Burgess St
- 18 Burgess St
- 19 Burgess St
- 18 Terry St
- 14 Burgess St
- 20 Burgess St
- 16 Terry St
- 13 Burgess St
- 20 Terry St
- 14 Terry St
- 30 Wellman Ave
- 21 Burgess St
- Lot 1 Selpan Way
- 11 Burgess St
- 24 Burgess St
- 76 Beauview Ave
- 76 Beauview Ave Unit 1 Bedroom Apartment
- 15 Terry St
- 22 Terry St