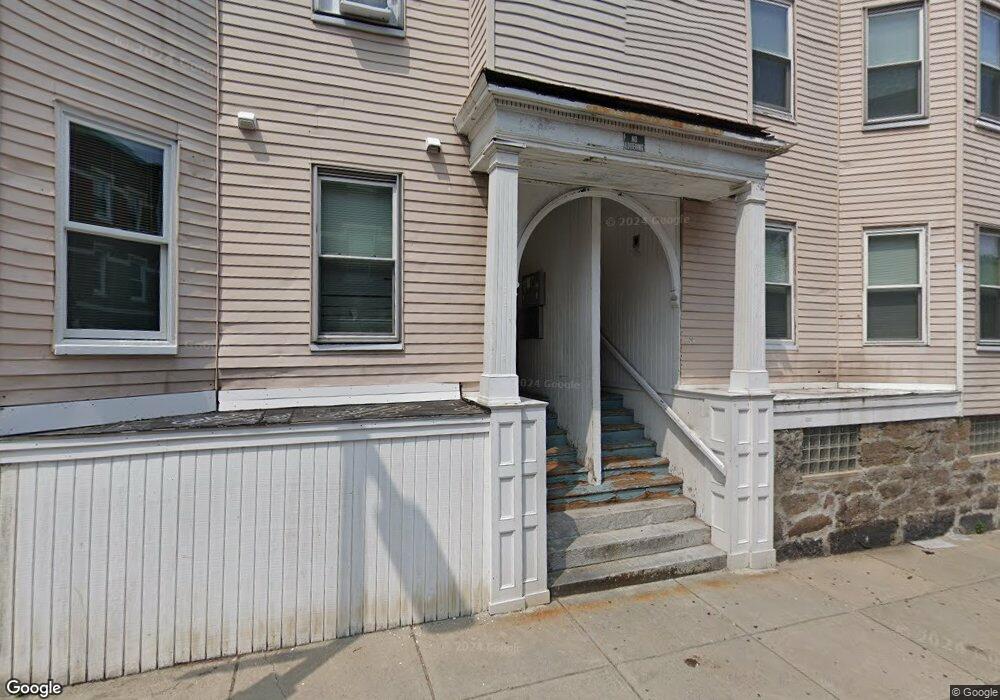
17 Burney St Roxbury Crossing, MA 02120
Mission Hill NeighborhoodEstimated Value: $1,798,000 - $2,232,000
6
Beds
3
Baths
3,278
Sq Ft
$619/Sq Ft
Est. Value
About This Home
This home is located at 17 Burney St, Roxbury Crossing, MA 02120 and is currently estimated at $2,030,707, approximately $619 per square foot. 17 Burney St is a home located in Suffolk County with nearby schools including Malik Academy and Manville School.
Ownership History
Date
Name
Owned For
Owner Type
Purchase Details
Closed on
Jan 6, 2021
Sold by
17 Burney Street Rt
Bought by
Burney Street 17-19 Llc
Current Estimated Value
Home Financials for this Owner
Home Financials are based on the most recent Mortgage that was taken out on this home.
Original Mortgage
$1,500,000
Outstanding Balance
$1,338,520
Interest Rate
2.7%
Mortgage Type
Purchase Money Mortgage
Estimated Equity
$692,187
Purchase Details
Closed on
May 11, 1993
Sold by
Progressive Cnsmrs Cu
Bought by
Mcelhinney Thomas J
Purchase Details
Closed on
Aug 7, 1992
Sold by
17 Burney St Rt
Bought by
Progressive Consum Fcu
Create a Home Valuation Report for This Property
The Home Valuation Report is an in-depth analysis detailing your home's value as well as a comparison with similar homes in the area
Home Values in the Area
Average Home Value in this Area
Purchase History
| Date | Buyer | Sale Price | Title Company |
|---|---|---|---|
| Burney Street 17-19 Llc | $1,600,000 | None Available | |
| Mcelhinney Thomas J | $32,000 | -- | |
| Progressive Consum Fcu | $126,000 | -- |
Source: Public Records
Mortgage History
| Date | Status | Borrower | Loan Amount |
|---|---|---|---|
| Open | Burney Street 17-19 Llc | $1,500,000 | |
| Previous Owner | Progressive Consum Fcu | $225,000 |
Source: Public Records
Tax History Compared to Growth
Tax History
| Year | Tax Paid | Tax Assessment Tax Assessment Total Assessment is a certain percentage of the fair market value that is determined by local assessors to be the total taxable value of land and additions on the property. | Land | Improvement |
|---|---|---|---|---|
| 2025 | $16,364 | $1,413,100 | $467,600 | $945,500 |
| 2024 | $16,727 | $1,534,600 | $533,200 | $1,001,400 |
| 2023 | $16,482 | $1,534,600 | $533,200 | $1,001,400 |
| 2022 | $16,207 | $1,489,600 | $517,600 | $972,000 |
| 2021 | $14,995 | $1,405,300 | $488,300 | $917,000 |
| 2020 | $14,140 | $1,339,000 | $391,200 | $947,800 |
| 2019 | $12,827 | $1,217,000 | $270,000 | $947,000 |
| 2018 | $11,806 | $1,126,500 | $270,000 | $856,500 |
| 2017 | $11,254 | $1,062,700 | $270,000 | $792,700 |
| 2016 | $10,165 | $924,100 | $270,000 | $654,100 |
| 2015 | $9,355 | $772,500 | $228,000 | $544,500 |
| 2014 | $8,274 | $657,700 | $228,000 | $429,700 |
Source: Public Records
Map
Nearby Homes
- 743 Parker St Unit 3
- 7 Oswald St
- 134-140 Smith St
- 24 Sachem St
- 22 Fisher Ave
- 6 Fisher Ave
- 249 Roxbury St Unit 1
- 155-157 Hillside St
- 78 Fort Ave Unit 78
- 10 Linwood St
- 1 Centre Street Terrace Unit 7
- 18 Eldora St
- 196 Hillside St Unit 2
- 196 Hillside St Unit 1
- 196 Hillside St Unit 3
- 820-824 Huntington Ave
- 92 Lawn St Unit 7-160
- 251 Heath St Unit 501
- 49 Norfolk St
- 51 Beech Glen St Unit 3
- 17 Burney St Unit 9-11 401
- 17 Burney St Unit 1
- 17 Burney St Unit 2
- 17 Burney St Unit 3
- 17 Burney St
- 19 Burney St Unit 19A
- 19 Burney St
- 19 Burney St Unit 3
- 19 Burney St Unit 2A
- 15 Burney St Unit 308
- 15 Burney St Unit 2
- 15 Burney St Unit 407
- 15 Burney St
- 73 Delle Ave Unit 1
- 73 Delle Ave
- 73 Delle Ave
- 73 Delle Ave Unit 2
- 11 Burney St Unit 3
- 11 Burney St Unit 2
- 11 Burney St Unit 1B