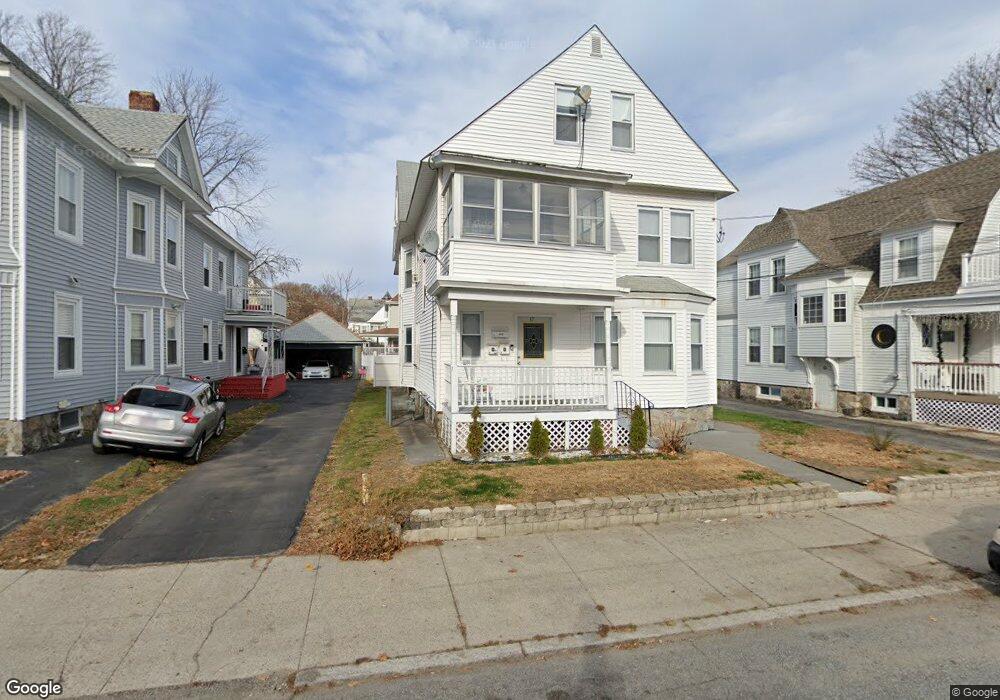
17 Byron Ave Lawrence, MA 01841
Tower Hill NeighborhoodEstimated Value: $474,252 - $838,000
6
Beds
2
Baths
3,102
Sq Ft
$230/Sq Ft
Est. Value
About This Home
This home is located at 17 Byron Ave, Lawrence, MA 01841 and is currently estimated at $712,813, approximately $229 per square foot. 17 Byron Ave is a home located in Essex County with nearby schools including James F. Hennessey School, Alexander B. Bruce School, and School For Exceptional Studies.
Ownership History
Date
Name
Owned For
Owner Type
Purchase Details
Closed on
May 21, 1999
Sold by
German Jose C
Bought by
Soto Angelo M
Current Estimated Value
Home Financials for this Owner
Home Financials are based on the most recent Mortgage that was taken out on this home.
Original Mortgage
$121,600
Outstanding Balance
$31,003
Interest Rate
6.88%
Mortgage Type
Purchase Money Mortgage
Estimated Equity
$681,810
Purchase Details
Closed on
May 30, 1997
Sold by
Pelson Rt
Bought by
German Jose C
Home Financials for this Owner
Home Financials are based on the most recent Mortgage that was taken out on this home.
Original Mortgage
$104,950
Interest Rate
8.09%
Mortgage Type
Purchase Money Mortgage
Purchase Details
Closed on
Mar 25, 1997
Sold by
Hager Margureite J
Bought by
Pelson Rt
Home Financials for this Owner
Home Financials are based on the most recent Mortgage that was taken out on this home.
Original Mortgage
$51,000
Interest Rate
7.68%
Mortgage Type
Purchase Money Mortgage
Create a Home Valuation Report for This Property
The Home Valuation Report is an in-depth analysis detailing your home's value as well as a comparison with similar homes in the area
Home Values in the Area
Average Home Value in this Area
Purchase History
| Date | Buyer | Sale Price | Title Company |
|---|---|---|---|
| Soto Angelo M | $128,000 | -- | |
| German Jose C | $105,000 | -- | |
| Pelson Rt | $40,000 | -- |
Source: Public Records
Mortgage History
| Date | Status | Borrower | Loan Amount |
|---|---|---|---|
| Open | Pelson Rt | $121,600 | |
| Previous Owner | Pelson Rt | $104,950 | |
| Previous Owner | Pelson Rt | $51,000 |
Source: Public Records
Tax History
| Year | Tax Paid | Tax Assessment Tax Assessment Total Assessment is a certain percentage of the fair market value that is determined by local assessors to be the total taxable value of land and additions on the property. | Land | Improvement |
|---|---|---|---|---|
| 2025 | $5,778 | $656,600 | $130,200 | $526,400 |
| 2024 | $5,446 | $588,800 | $125,900 | $462,900 |
| 2023 | $5,475 | $538,900 | $110,200 | $428,700 |
| 2022 | $4,982 | $435,500 | $102,400 | $333,100 |
| 2021 | $4,734 | $385,800 | $102,400 | $283,400 |
| 2020 | $4,428 | $356,200 | $86,800 | $269,400 |
| 2019 | $4,497 | $328,700 | $75,100 | $253,600 |
| 2018 | $4,495 | $313,900 | $71,800 | $242,100 |
| 2017 | $3,968 | $258,700 | $69,300 | $189,400 |
| 2016 | $3,933 | $253,600 | $49,300 | $204,300 |
| 2015 | $3,723 | $246,200 | $49,300 | $196,900 |
Source: Public Records
Map
Nearby Homes
- 1082 Essex St
- 1 Perry Ave
- 1100 Essex St
- 1008 Essex St Unit 1010
- 42-44 Cypress Ave
- 14-16 Cypress Ave
- 1146 Essex St
- 70 Butler St
- 13 Caswell Ave
- 11 Crescent St
- 15 Crescent St Unit D
- 499 Haverhill St
- 19 Oregon Ave
- 76 Haverhill St
- 18 Doyle St
- 42 Morton St
- 312 Water St Unit 4
- 945 Riverside Dr Unit 3B
- 179-181 West St
- 82 Water St
- 15 Byron Ave
- 21 Byron Ave Unit 23
- 25 Byron Ave Unit 27
- 9-11 Byron Ave
- 9 Byron Ave Unit 11
- 25-27 Byron Ave
- 28 Smith St
- 30 Smith St
- 31 Byron Ave
- 20 Smith St
- 18 Byron Ave
- 34 Smith St Unit 36
- 22 Byron Ave
- 14 Byron Ave
- 292-294 Ames St
- 292 Ames St Unit 294
- 296 Ames St Unit 2
- 296 Ames St
- 296 Ames St Unit 1
- 296 Ames St Unit 3
Your Personal Tour Guide
Ask me questions while you tour the home.