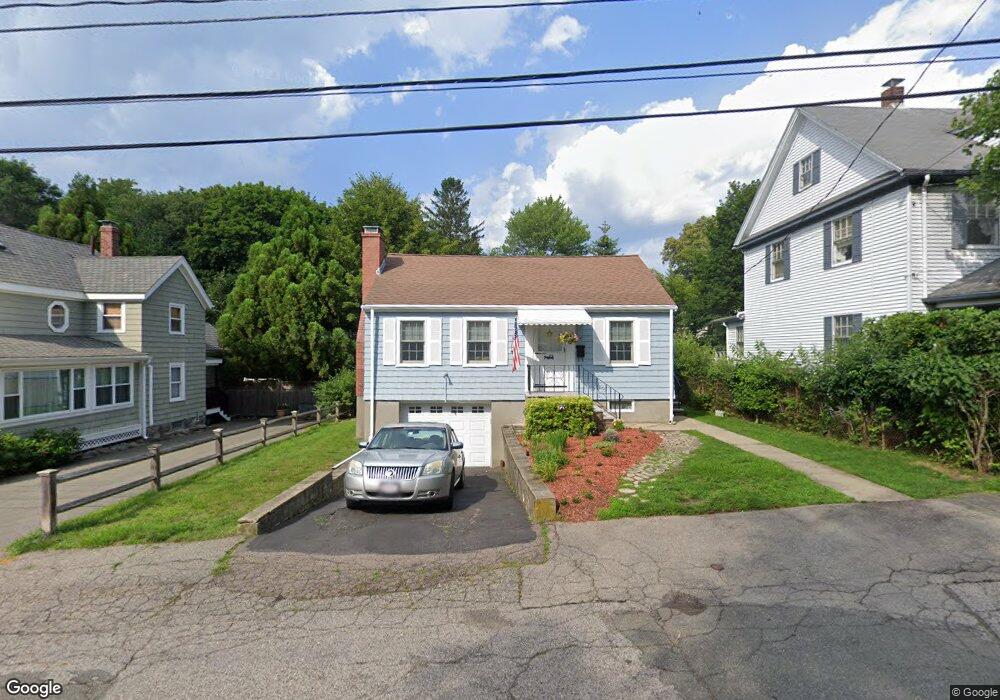
17 Capen St Milton, MA 02186
Columbine Cliffs NeighborhoodEstimated Value: $670,000 - $988,000
2
Beds
1
Bath
1,082
Sq Ft
$732/Sq Ft
Est. Value
About This Home
This home is located at 17 Capen St, Milton, MA 02186 and is currently estimated at $792,158, approximately $732 per square foot. 17 Capen St is a home located in Norfolk County with nearby schools including Milton High School, KIPP Academy Boston Charter School, and St. Mary of the Hills School.
Ownership History
Date
Name
Owned For
Owner Type
Purchase Details
Closed on
Apr 30, 2009
Sold by
Snow Dorothy R and Ouillette Dorothy E
Bought by
Lawson Kelly M and Mulligan James E
Current Estimated Value
Home Financials for this Owner
Home Financials are based on the most recent Mortgage that was taken out on this home.
Original Mortgage
$210,000
Outstanding Balance
$132,754
Interest Rate
4.86%
Mortgage Type
Purchase Money Mortgage
Estimated Equity
$659,404
Create a Home Valuation Report for This Property
The Home Valuation Report is an in-depth analysis detailing your home's value as well as a comparison with similar homes in the area
Home Values in the Area
Average Home Value in this Area
Purchase History
| Date | Buyer | Sale Price | Title Company |
|---|---|---|---|
| Lawson Kelly M | $262,500 | -- |
Source: Public Records
Mortgage History
| Date | Status | Borrower | Loan Amount |
|---|---|---|---|
| Open | Lawson Kelly M | $210,000 |
Source: Public Records
Tax History
| Year | Tax Paid | Tax Assessment Tax Assessment Total Assessment is a certain percentage of the fair market value that is determined by local assessors to be the total taxable value of land and additions on the property. | Land | Improvement |
|---|---|---|---|---|
| 2025 | $7,487 | $675,100 | $466,200 | $208,900 |
| 2024 | $6,986 | $639,700 | $444,000 | $195,700 |
| 2023 | $6,882 | $603,700 | $423,100 | $180,600 |
| 2022 | $7,028 | $563,600 | $423,100 | $140,500 |
| 2021 | $6,648 | $506,300 | $372,500 | $133,800 |
| 2020 | $6,490 | $494,700 | $356,900 | $137,800 |
| 2019 | $6,330 | $480,300 | $346,500 | $133,800 |
| 2018 | $6,040 | $437,400 | $303,400 | $134,000 |
| 2017 | $5,649 | $416,600 | $288,900 | $127,700 |
| 2016 | $6,148 | $455,400 | $330,200 | $125,200 |
| 2015 | $5,102 | $366,000 | $240,800 | $125,200 |
Source: Public Records
Map
Nearby Homes
- 44 Allen Cir
- 72 Columbine Rd
- 214 Brook Rd
- 259 Central Ave
- 168 Brook Rd
- 8 Faunce Rd Unit A
- 80 Blue Hills Pkwy
- 16 Blue Hill Ave
- 137 Thacher St Unit 137
- 8 Violet St
- 424 Brook Rd
- 853 Cummins Hwy
- 4 Crossman St Unit 4
- 29/31 Belvoir Rd
- 82 Blue Hill Ave
- 11 French St
- 36 Central Ave Unit 4
- 67 Idaho St
- 95 Woodhaven St
- 640 River St
Your Personal Tour Guide
Ask me questions while you tour the home.