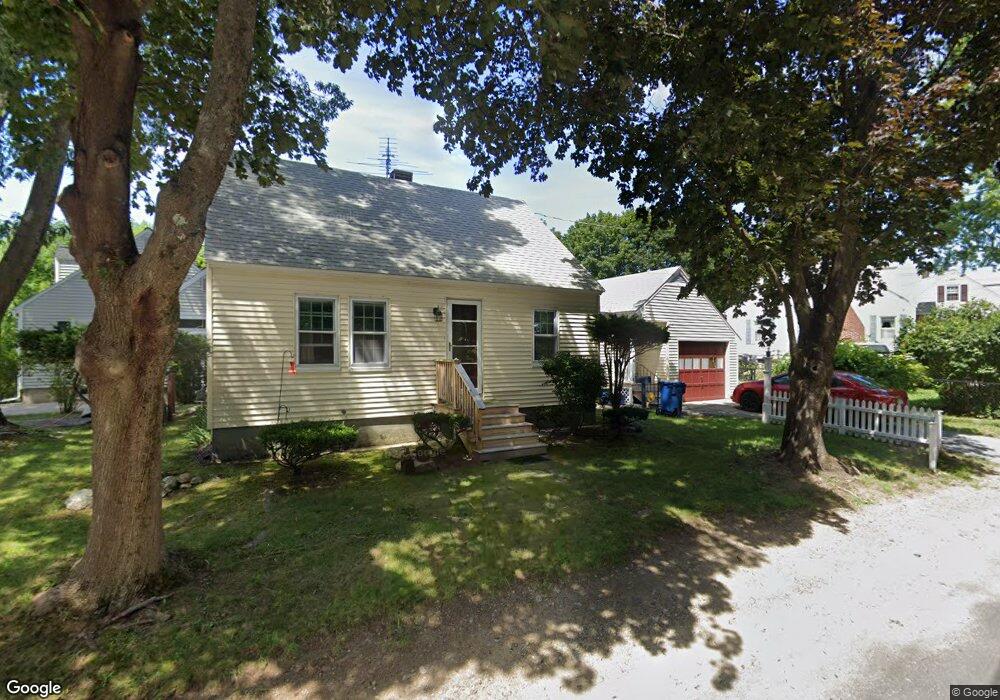
17 Chickering Rd Lawrence, MA 01843
Colonial Heights NeighborhoodEstimated Value: $493,000 - $563,000
3
Beds
2
Baths
1,378
Sq Ft
$385/Sq Ft
Est. Value
About This Home
This home is located at 17 Chickering Rd, Lawrence, MA 01843 and is currently estimated at $530,156, approximately $384 per square foot. 17 Chickering Rd is a home located in Essex County with nearby schools including John Breen School, South Lawrence East Elementary School, and School For Exceptional Studies.
Ownership History
Date
Name
Owned For
Owner Type
Purchase Details
Closed on
Nov 15, 2019
Sold by
Mello Cheryl
Bought by
Cheryl A Mello Ret
Current Estimated Value
Purchase Details
Closed on
Mar 24, 1994
Sold by
Petty David A
Bought by
Haphey Allen
Home Financials for this Owner
Home Financials are based on the most recent Mortgage that was taken out on this home.
Original Mortgage
$85,400
Interest Rate
7.15%
Mortgage Type
Purchase Money Mortgage
Create a Home Valuation Report for This Property
The Home Valuation Report is an in-depth analysis detailing your home's value as well as a comparison with similar homes in the area
Home Values in the Area
Average Home Value in this Area
Purchase History
| Date | Buyer | Sale Price | Title Company |
|---|---|---|---|
| Cheryl A Mello Ret | -- | None Available | |
| Haphey Allen | $89,900 | -- |
Source: Public Records
Mortgage History
| Date | Status | Borrower | Loan Amount |
|---|---|---|---|
| Previous Owner | Haphey Allen | $90,000 | |
| Previous Owner | Haphey Allen | $85,400 |
Source: Public Records
Tax History
| Year | Tax Paid | Tax Assessment Tax Assessment Total Assessment is a certain percentage of the fair market value that is determined by local assessors to be the total taxable value of land and additions on the property. | Land | Improvement |
|---|---|---|---|---|
| 2025 | $3,661 | $416,000 | $138,300 | $277,700 |
| 2024 | $3,474 | $375,600 | $121,100 | $254,500 |
| 2023 | $3,655 | $359,700 | $121,100 | $238,600 |
| 2022 | $3,536 | $309,100 | $108,000 | $201,100 |
| 2021 | $3,272 | $266,700 | $104,400 | $162,300 |
| 2020 | $3,054 | $245,700 | $89,500 | $156,200 |
| 2019 | $3,157 | $230,800 | $92,900 | $137,900 |
| 2018 | $3,062 | $213,800 | $91,200 | $122,600 |
| 2017 | $2,935 | $191,300 | $88,600 | $102,700 |
| 2016 | $2,606 | $168,000 | $63,300 | $104,700 |
| 2015 | $2,413 | $159,600 | $54,900 | $104,700 |
Source: Public Records
Map
Nearby Homes
- 12B Stevens St
- 356-360 S Union St
- 27-29 Dorchester St
- 46-46A Dorchester St
- 341 S Broadway- Parcel II
- 24 Inman St Unit 4
- 31 Garfield St
- 102 Weare St
- 350 Greene St Unit 410
- 350 Greene St Unit 305
- 91-93 Andover St
- 119 Andover St
- 87-87A Brookfield St
- 28 Stirling St
- 183 Farnham St Unit 189
- 161-167 S Union St
- 11 W Hawley St
- 42 York St
- 151-153 Bailey St
- 100 Bailey St Unit 1
Your Personal Tour Guide
Ask me questions while you tour the home.