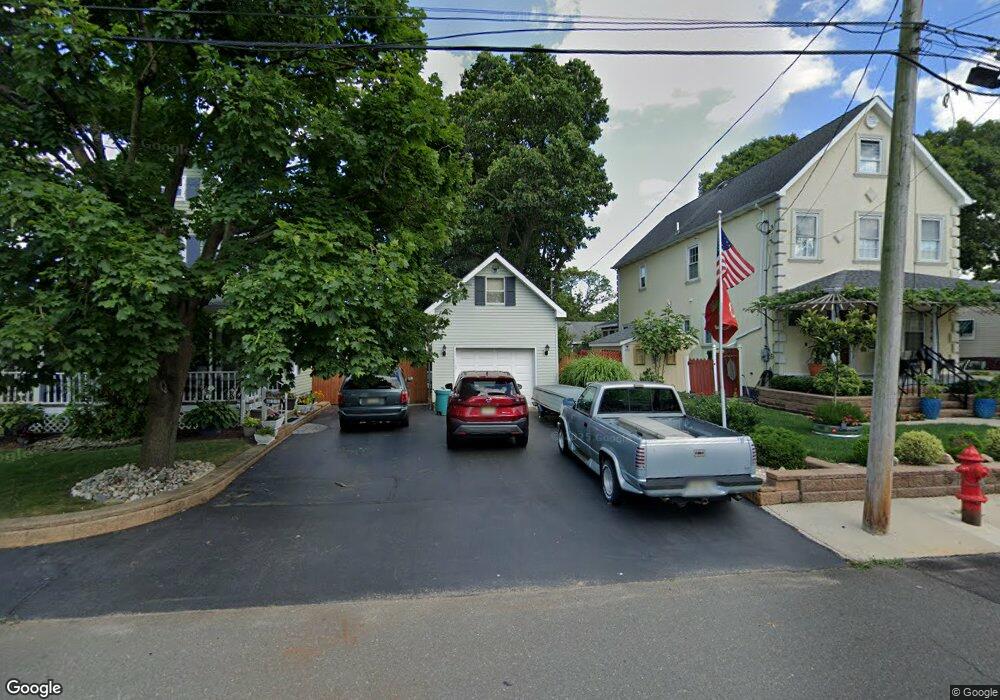
17 Chingarora Ave Keyport, NJ 07735
Estimated Value: $655,664 - $697,000
3
Beds
1
Bath
2,136
Sq Ft
$321/Sq Ft
Est. Value
About This Home
This home is located at 17 Chingarora Ave, Keyport, NJ 07735 and is currently estimated at $685,916, approximately $321 per square foot. 17 Chingarora Ave is a home located in Monmouth County with nearby schools including Keyport Central School, Keyport High School, and St. Joseph Elementary School.
Ownership History
Date
Name
Owned For
Owner Type
Purchase Details
Closed on
Nov 19, 2015
Sold by
Aumack Robert and Aumack Ii Harry
Bought by
Bourneche Hafedh
Current Estimated Value
Purchase Details
Closed on
Feb 12, 2015
Sold by
Arnella Bernard
Bought by
Aumack Ii Harry and Aumack Robert
Purchase Details
Closed on
May 21, 2007
Sold by
Henriksen John David and Arnella Doris
Bought by
Henriksen John David and Arnella Doris
Create a Home Valuation Report for This Property
The Home Valuation Report is an in-depth analysis detailing your home's value as well as a comparison with similar homes in the area
Home Values in the Area
Average Home Value in this Area
Purchase History
| Date | Buyer | Sale Price | Title Company |
|---|---|---|---|
| Bourneche Hafedh | $105,000 | None Available | |
| Aumack Ii Harry | $65,000 | None Available | |
| Henriksen John David | -- | None Available |
Source: Public Records
Tax History Compared to Growth
Tax History
| Year | Tax Paid | Tax Assessment Tax Assessment Total Assessment is a certain percentage of the fair market value that is determined by local assessors to be the total taxable value of land and additions on the property. | Land | Improvement |
|---|---|---|---|---|
| 2025 | $12,824 | $671,100 | $229,000 | $442,100 |
| 2024 | $12,702 | $619,500 | $199,100 | $420,400 |
| 2023 | $12,702 | $577,900 | $181,000 | $396,900 |
| 2022 | $5,949 | $502,400 | $157,400 | $345,000 |
| 2021 | $5,949 | $235,700 | $145,800 | $89,900 |
| 2020 | $5,742 | $225,800 | $140,300 | $85,500 |
| 2019 | $5,342 | $210,400 | $135,000 | $75,400 |
| 2018 | $5,343 | $205,500 | $135,000 | $70,500 |
| 2017 | $5,206 | $199,700 | $130,000 | $69,700 |
| 2016 | $5,315 | $205,600 | $130,000 | $75,600 |
| 2015 | $4,674 | $189,600 | $115,000 | $74,600 |
| 2014 | $4,308 | $177,200 | $90,000 | $87,200 |
Source: Public Records
Map
Nearby Homes
- 8 Chingarora Ave
- 95 Broadway
- 127 Chingarora Ave
- 253 Broadway
- 1 Hobart St
- 52 Highway 35
- 9 Monmouth Place
- 324 Maple Place
- 90 Saint Peters Place
- 369 Riverdale Dr
- 22 Lower Main St
- 226 Osborn St
- 55 E Front St
- 40 Church St
- 195 Atlantic St
- 231 Atlantic St Unit 23
- 557 Lloyd Rd Unit B
- 128 1st St
- 910 Malden Dr
- 25-27 Brook Ave
- 10 Luppatatong Ave
- 25 Chingarora Ave
- 20 Luppatatong Ave
- 8 Luppatatong Ave
- 11 Chingarora Ave
- 35 Chingarora Ave
- 6 Luppatatong Ave
- 22 Luppatatong Ave
- 3 Chingarora Ave
- 1 Chingarora Ave
- 11 Luppatatong Ave
- 23 Luppatatong Ave
- 21 Luppatatong Ave
- 12 Chingarora Ave
- 5 Luppatatong Ave
- 41 Chingarora Ave
- 28 Chingarora Ave
- 10 Chingarora Ave
- 26 Luppatatong Ave
- 30 Chingarora Ave