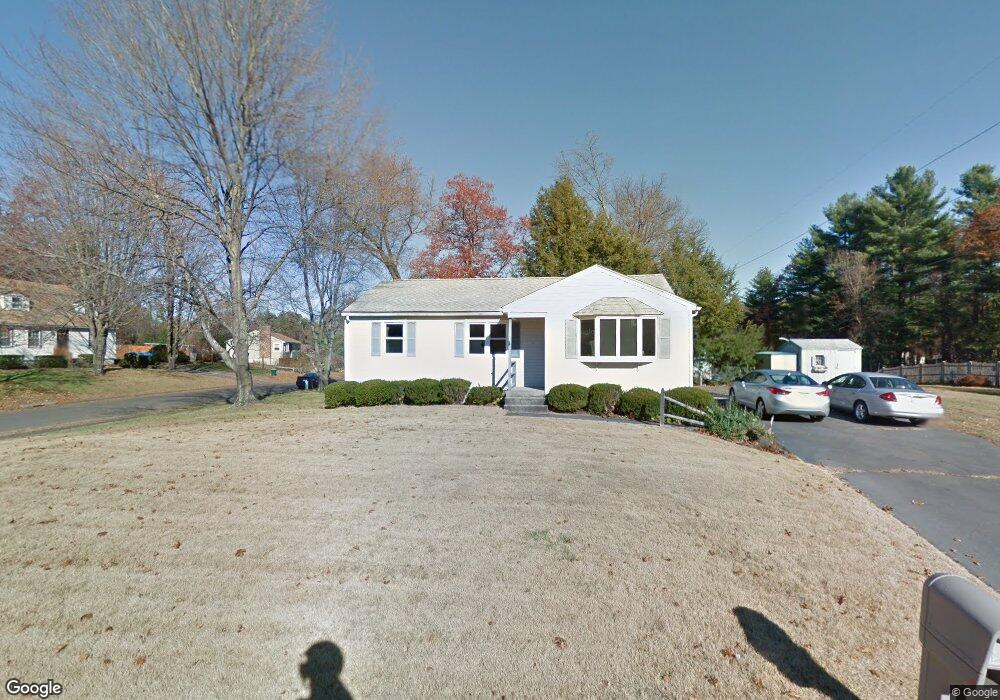
17 Coed Dr Easthampton, MA 01027
Estimated Value: $343,771 - $369,000
3
Beds
2
Baths
1,011
Sq Ft
$357/Sq Ft
Est. Value
About This Home
This home is located at 17 Coed Dr, Easthampton, MA 01027 and is currently estimated at $360,943, approximately $357 per square foot. 17 Coed Dr is a home located in Hampshire County with nearby schools including Easthampton High School, Calvary Baptist Christian School, and Tri-County Schools.
Ownership History
Date
Name
Owned For
Owner Type
Purchase Details
Closed on
Aug 30, 2023
Sold by
Carey Lori A
Bought by
Blanchette Paul A and Blanchette Kathleen A
Current Estimated Value
Purchase Details
Closed on
Oct 5, 2021
Sold by
Blanchette Paul A and Blanchette Kathleen A
Bought by
Carey Lori A
Purchase Details
Closed on
Oct 12, 2012
Sold by
Blanchette Paul A and Blanchette Kathleen A
Bought by
Blanchette Paul A and Blanchette Kathleen A
Create a Home Valuation Report for This Property
The Home Valuation Report is an in-depth analysis detailing your home's value as well as a comparison with similar homes in the area
Home Values in the Area
Average Home Value in this Area
Purchase History
| Date | Buyer | Sale Price | Title Company |
|---|---|---|---|
| Blanchette Paul A | -- | None Available | |
| Carey Lori A | -- | None Available | |
| Blanchette Paul A | -- | -- |
Source: Public Records
Tax History
| Year | Tax Paid | Tax Assessment Tax Assessment Total Assessment is a certain percentage of the fair market value that is determined by local assessors to be the total taxable value of land and additions on the property. | Land | Improvement |
|---|---|---|---|---|
| 2025 | $4,337 | $317,300 | $112,500 | $204,800 |
| 2024 | $4,186 | $308,700 | $109,200 | $199,500 |
| 2023 | $3,164 | $216,000 | $85,900 | $130,100 |
| 2022 | $3,570 | $216,000 | $85,900 | $130,100 |
| 2021 | $3,906 | $222,700 | $85,900 | $136,800 |
| 2020 | $3,836 | $216,000 | $85,900 | $130,100 |
| 2019 | $2,964 | $191,700 | $85,900 | $105,800 |
| 2018 | $3,046 | $190,400 | $81,100 | $109,300 |
| 2017 | $2,975 | $183,500 | $78,100 | $105,400 |
| 2016 | $2,861 | $183,500 | $78,100 | $105,400 |
| 2015 | $2,780 | $183,500 | $78,100 | $105,400 |
Source: Public Records
Map
Nearby Homes
Your Personal Tour Guide
Ask me questions while you tour the home.